


✍️ Weekly Trade Plan 17th-22nd September
The FOMC 🎪 circus is in town.

This is a sample newsletter giving an idea of what to expect for the paid premium service…
In this newsletter, we’ll look at the Dollar Index, S&P, Gold, Silver and Bitcoin. 💡 If you have a favourite asset that you’d like me to analyse, let me know and I may even cover it!
Please note: Prices quoted may be different according to the broker you are using, which contract you are trading and whether you trade spot, futures, CFD’s or Spreadbet.
Be sure to click on charts and view at a larger size, especially as thin lines may not be visible.
The FOMC circus 🎪 is in town, which means I expect the market to be fairly dull until the main event on Wednesday when J. Powell takes the podium.
Expect a volatile 2nd half of the week, as we see bank rates and press conferences from both the UK and Switzerland on Thursday.
Finally, the Bank Of Japan press conference, UK Retail sales and Europe PMIs may move the market on Friday.
With that in mind, I’ll be watching the Dollar Index and the S&P carefully during FOMC to see if my FOMC strategy sets up after Powell stops talking.
The Dollar/DXY
We won’t always look at monthly charts, but this one is worthy of our attention.
We have an approximate multi-decade channel that started in 2008.
Although there is only one low lining up, take a look at that mid line and see how price reacts either side of the highlighted areas.
Now, focus your gaze to the triangle on the right. It faked out the bottom, bounced from the mid line and now has a solid green candle out of the top side.
If this candle closes the month green, we could see 110.60 in 2024. For now, it’s giving a firm bullish bias to this pair.

Zooming in on the weekly, you can now see why I drew the Supply Zone to start at 110.60. Also, notice the failed Supply zone in the triangle and the “V” shape into it - this is another bullish sign.
On this timeframe, I am looking for longs towards the shorter term target of 107.93.

Here’s the 4 hour chart showing my levels of interest - I won’t go lower than this on the DXY this week, especially as FOMC could be volatile and closer levels will be blown out of the water!
There will be stops residing above the swing high of 105.88 from March 2023 and the market may attempt to head there during FOMC.
After Powell stops speaking, if we have an upside down “V”, I may consider a riskier counter-trend short to the first weak level.
For swing longs, I will buy at 103.70 with a stop at 102.94. Initial target will be 105.88 and then 107.93 as mentioned before.

S&P 500
Let me first say, I am not a fan of the S&P at the moment, as it has been choppy and directionless.
However, if you were to put a gun to my head and ask me where it’s going, price action and structure are looking bullish and projections point to the old high of 4820.
The spike low (circled) into the white Price Pivot Zone at 3524 started the move up. We have another Price Pivot Zone (PPZ) at 4195 - this is the level the market may want to retest before heading back up.

With that in mind, looking at the 4 hour chart, I also have smaller PPZ levels at 4540, 4451, 4340 and 4233.
One way to play these would be to wait for break and retest setups on the way down (entries indicated by the red arrows) and the same on the way up (indicated by green arrows).
Eagle eyed readers will notice the yellow demand zone lines up with the white PPZ at 4195 that I showed you on the weekly chart.
As a side note, I’d like to make an important point here: Nothing is set in stone and I cannot force my will on the market. The best we can do as traders is plot levels and see if the market will visit them and give a setup.

Gold
Investors waiting for a moonshot 🚀🌑 are having to be very patient.
So what is going on with Gold? Let’s take a look at the weekly chart…
For 2 years, Gold has been ranging between 1680 and 2075. It failed twice to take out August 2020’s all-time high of 2075.
On the downside, notice how it momentarily too out the red support level of 1680 (where many stops would have resided) before hopping back above that red line and forming a bullish “V”. When it climbed above the (purple circled) PPZ, it retested and shot back up. All of these signs are somewhat bullish, but as you may have worked out… Gold is in no hurry!

With no clear intention to move out of it’s range, the best way to play Gold is from level to level.
You may have spotted my thinner white Price Pivot Zones on Twitter. These have continued to work very well, giving long and short trades in the ranges.
Here’s the daily chart with those PPZ’s and a bull channel that may break up eventually. Of particular interest to me is the untested PPZ of 1858 - I will be looking to take a long from that level and hold a portion as a swing long.

For day traders, here’s two potential areas for longs on the hourly chart. The circled area exhibits bullish price action and with that in mind, I am looking for longs from 1914 and 1920 with a target of 1936. A stop below that tiny demand would be very tight for gold, therefore stops in both cases will go below the circled area at 1901.

A word of warning: When taking lower timeframe setups, it is best to wait until volatile economic news are over. I refer in particular to the upcoming FOMC, SNB and BOE rate announcements, which could blow smaller levels out of the water. 💥
Silver
I can’t talk about Gold without mentioning Silver and some of you would have seen these charts on Twitter, but I’ll run through them anyway.
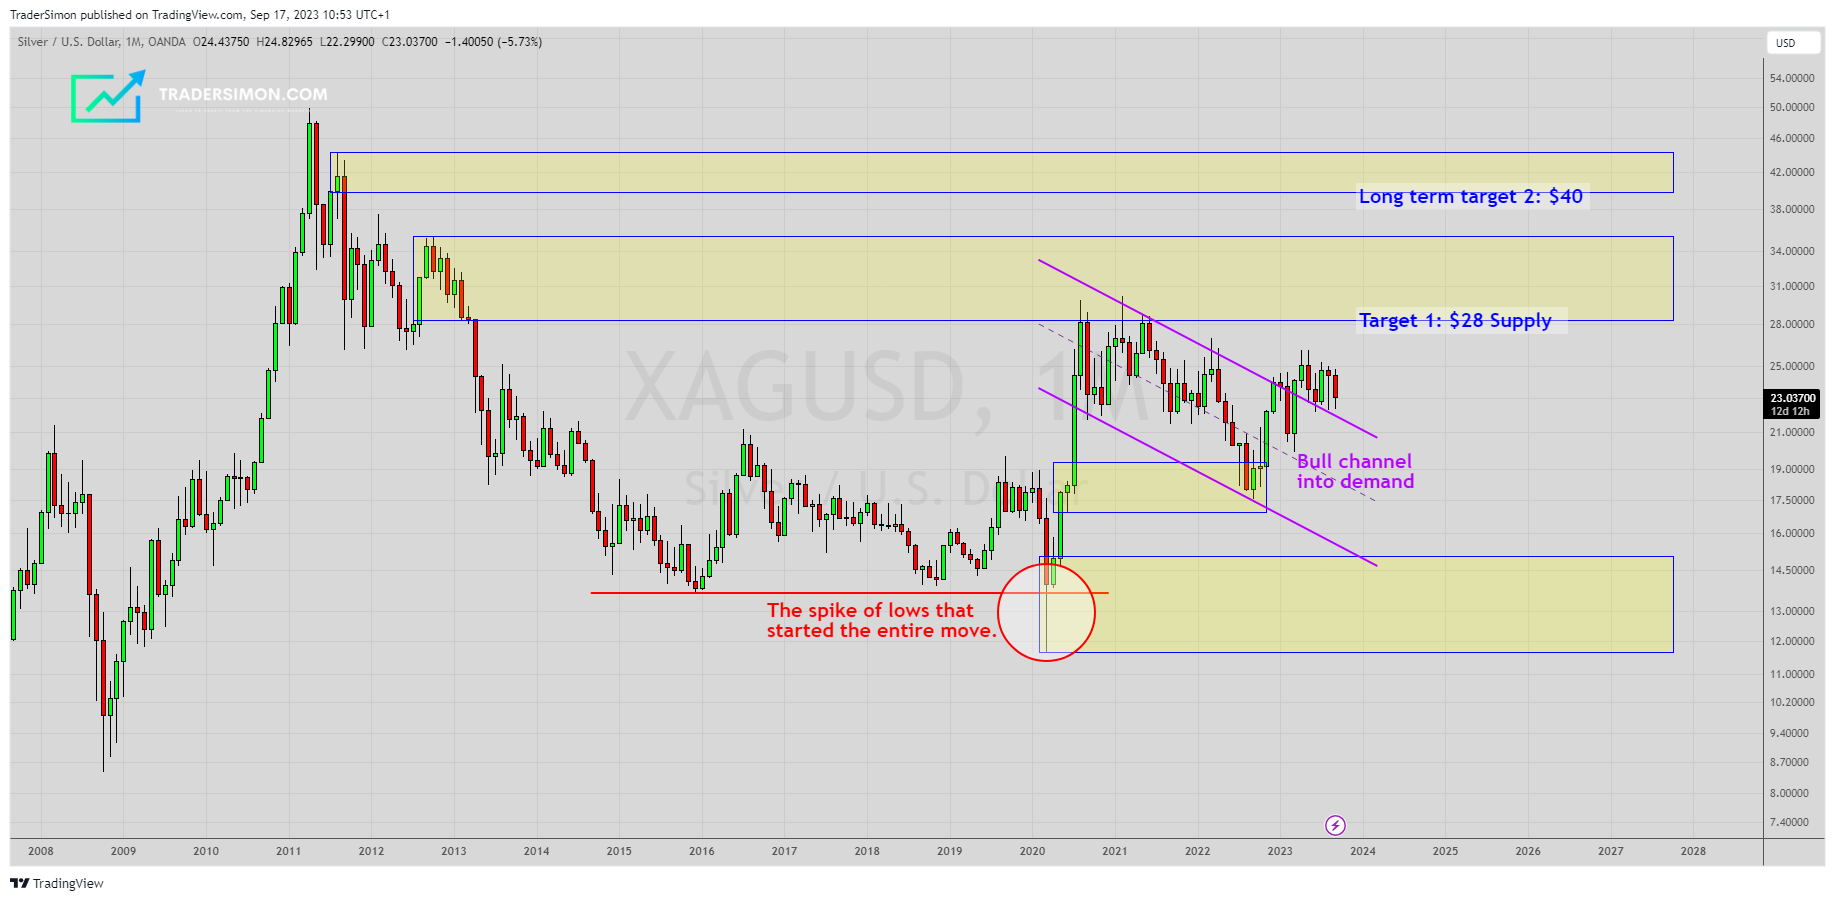
This is the monthly Silver chart and some of you may remember, way back in the day when I had a mentorship group, I called Silver long after the spike rejection of 13.65.
There are many bullish signs on this chart, including the sharp “V” shape after the spiked and the Bull Channel that came back down to test demand.
Long term targets remain at $28 and $40, however the $28 level is very strong and it would not surprise me if it retraces violently from there.
Silver is a lot harder than Gold to play on the lower timeframes because of thinner liquidity, so there is no need to go lower than the daily chart for now.
Here’s the daily and you’ve probably seen this on my Twitter feed. Using my Prize Pivot Zones, I plotted two paths to take it to the first target of $28.
We have good confluence of the top side of the channel and Demand. Look how price is respecting that purple line.
It should come as no surprise that I’m looking for longs at around the 21.40 level of confluence.

Gold Vs Silver ratio/XAUXAG
A quick look at the relative strength of Gold Vs Silver. I’ve been using this weekly chart for some time, to illustrate I expect Silver to appreciate much quicker than Gold (Gold to depreciate Vs. Silver).
Following the blow-off top, the market retraced to Supply before dropping again.
It has now compressed into a tight triangle and multiple projections are suggesting it will break down to $49.
Bear in mind this is a weekly chart and it will not happen overnight!

And finally… Bitcoin.
Let’s start with the weekly chart and quite a few price levels here!
Currently Bitcoin is ranging between the blue PPZ at 25,214 and Supply at 29,275.
It’s my feeling we are likely to see the market move to the demand zone below at 22,432. However, if I’m wrong and Bitcoin breaks above current Supply, then 37,000 is next on the cards.
Conversely, If Demand at 22,432 fails to hold (or only gives a minor bounce) AND we get some really bearish news related to Binance, Tether or some other black swan event Bitcoin may want to dive down to the untested level of 13,868, followed by Demand at 11,514.
However, I don’t want to panic you just yet, so let’s take it one level at a time!

Here’s the daily chart and a path (in black) that I published on Twitter.
If it plays out how I think it will, we should see a break of that blue PPZ and 24,280 next.
There’s a great deal of bearish action on this chart, including:
The hold below the purple circled PPZ.
The price action to the left of my comment, including the upside down “V”.
The hold below Supply.
The impulse up move after the bull channel that was fully reversed in the same amount of time.
Because of this, in the medium term, I’m looking for a move down to around 22,432.

That’s all for now!
I hope you’ve enjoyed this sample trade plan and found the information useful. Let me know what you liked/disliked/would like to see more of.
I’ll follow up with some short posts during the week when something affecting my trade plans happens.
Going forward, I’m aiming to launch this service within a week or two and I’ll inform subscribers as soon as it opens.
Enjoy the rest of your weekend!
Simon