


✍️ Weekly Trade Plan & Recap 12th - 17th January
Could an explosive bull move in WTI Oil be coming? Plus, we outline the criteria for a Bitcoin Bear move to 46k, and analysis for the DXY, Euro, S&P 500, Gold, Silver and Crypto Alts.

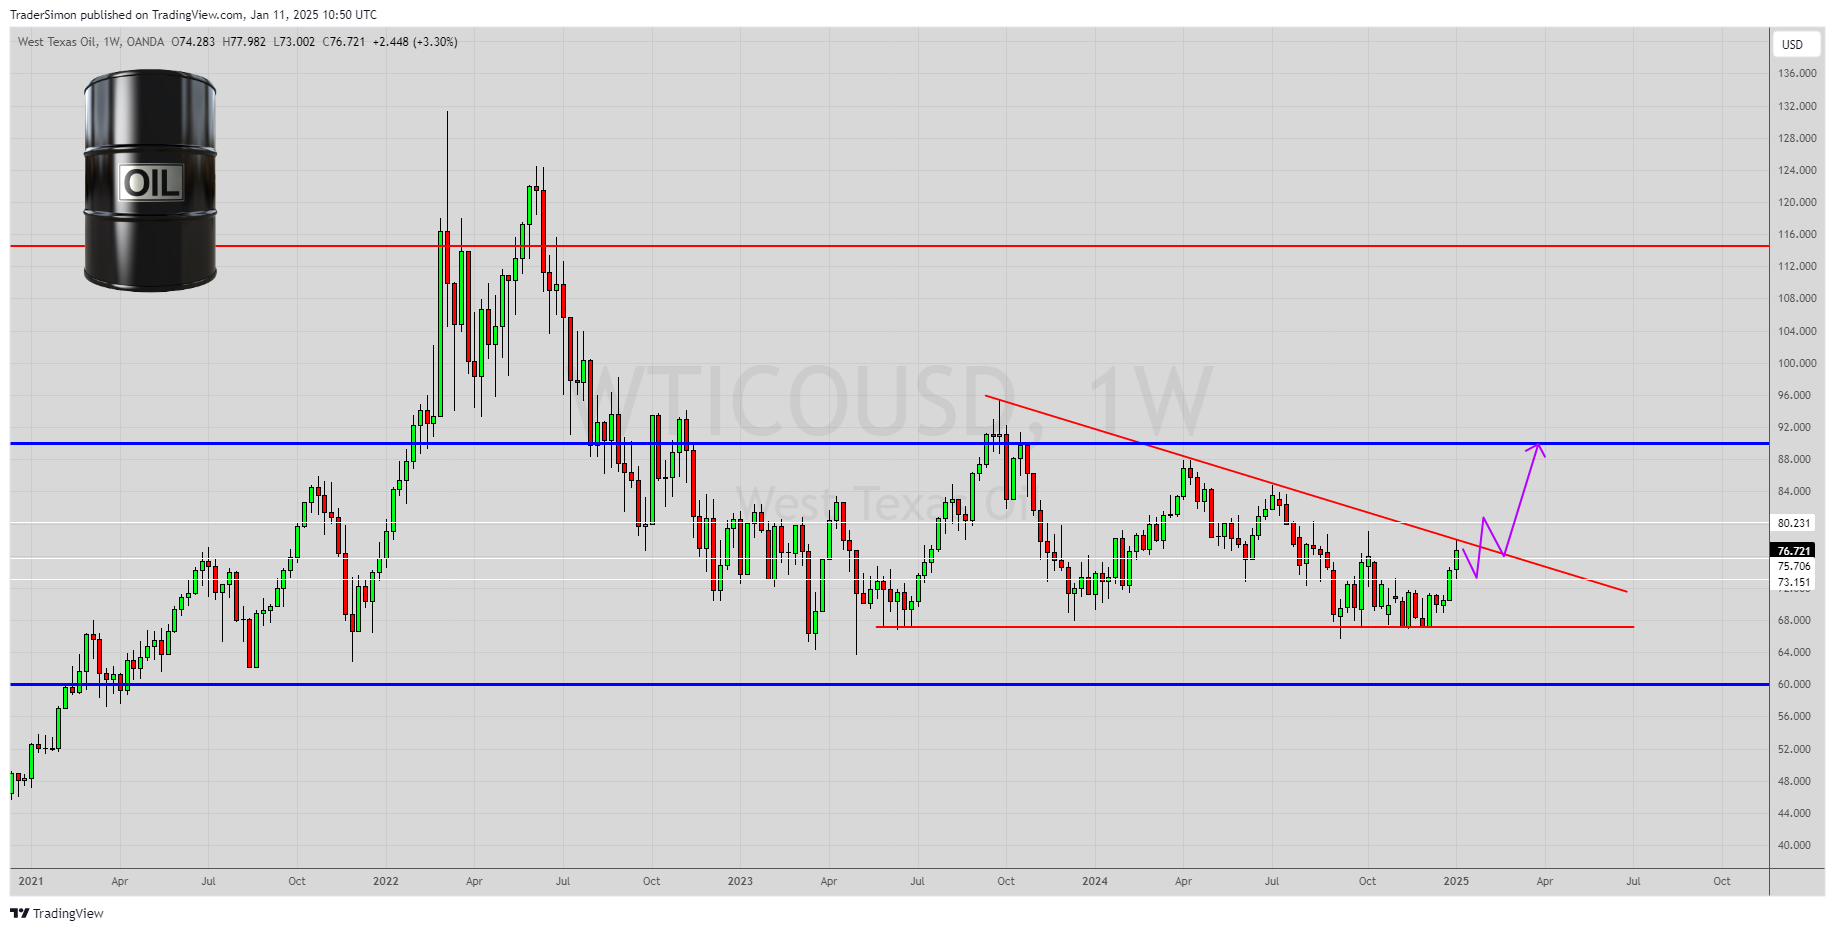
Could an explosive move in WTI Oil be coming?
The WTI Oil weekly chart has gradually compressed into a downward sloping triangle.
The result of price gradually compressing tighter like this is often an explosive move to the upside, so I am calling a target of $90.
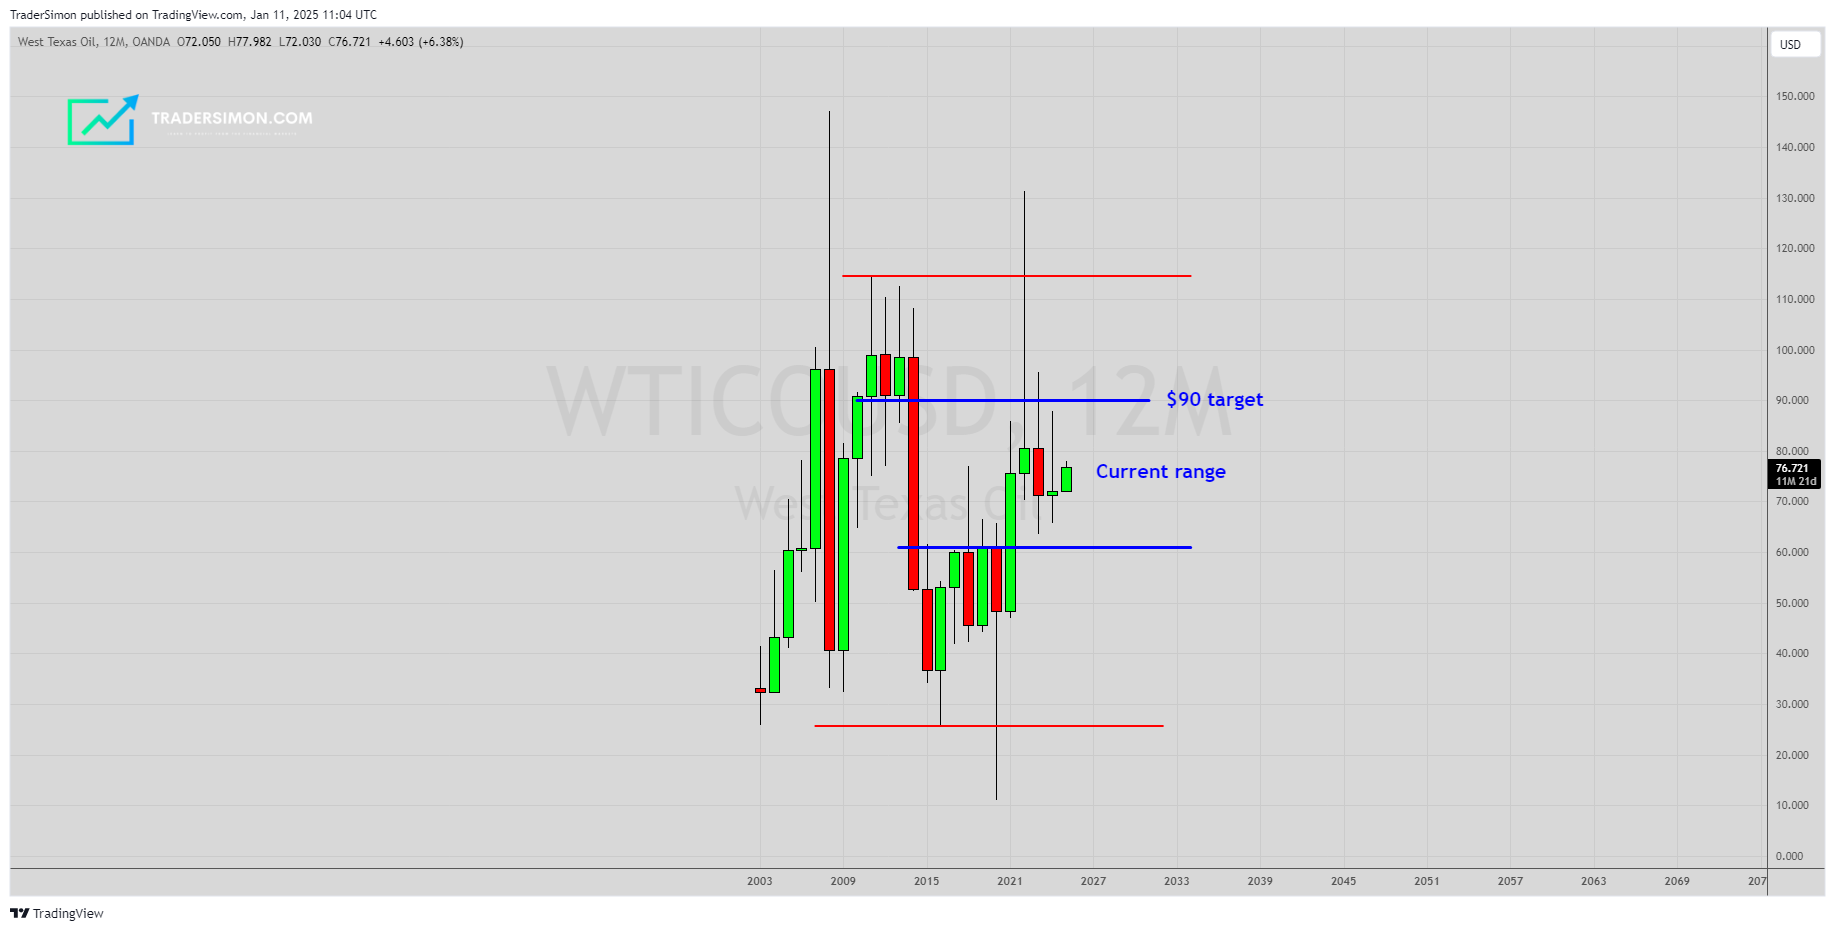
Non-members may wonder why the blue support and resistance lines are placed as they are.
For that, we need to look at a yearly chart and see the yearly candle bodies have formed a clear range where we expect price to trade. Therefore, the $90 upper bound of the range forms our minimum target.
More about WTI Oil later in this newsletter and how we plan to position ourselves long in this market.
Bitcoin
Last September, I called a long in Bitcoin from 61,900 with a target of 90k by the US Presidential elections.
I then warned the 1.618 Fibonacci extension at 102k was an important level to watch and that price may pause or reverse here.
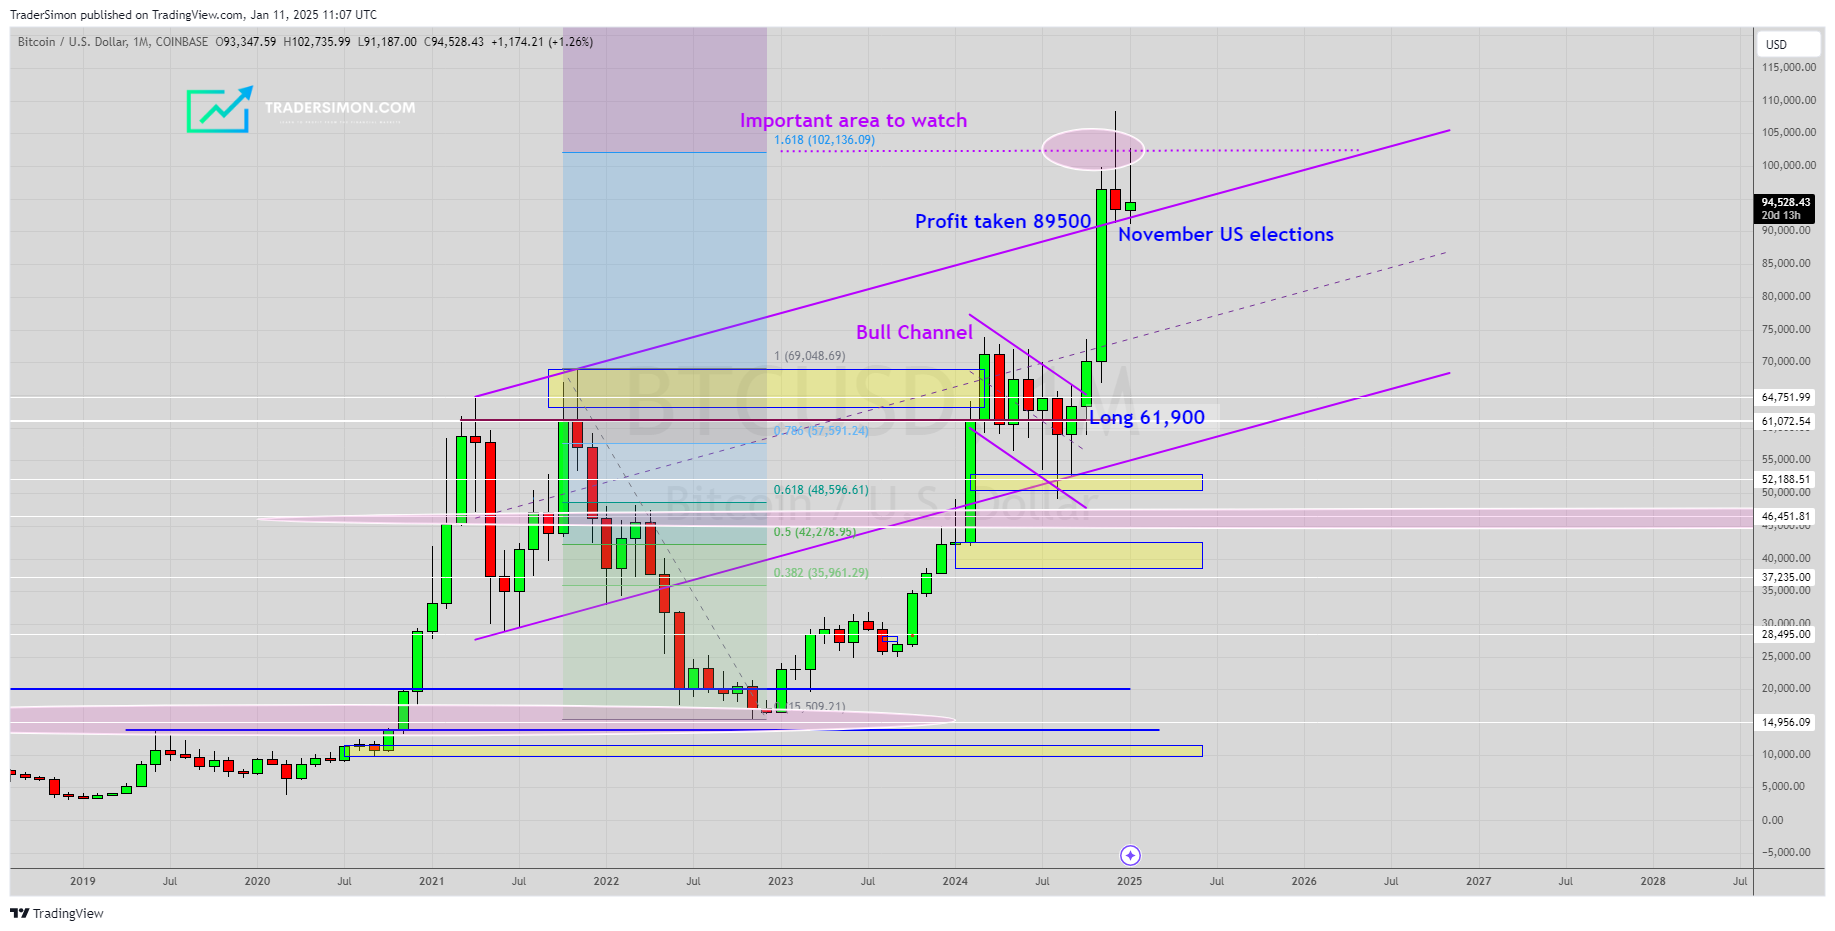
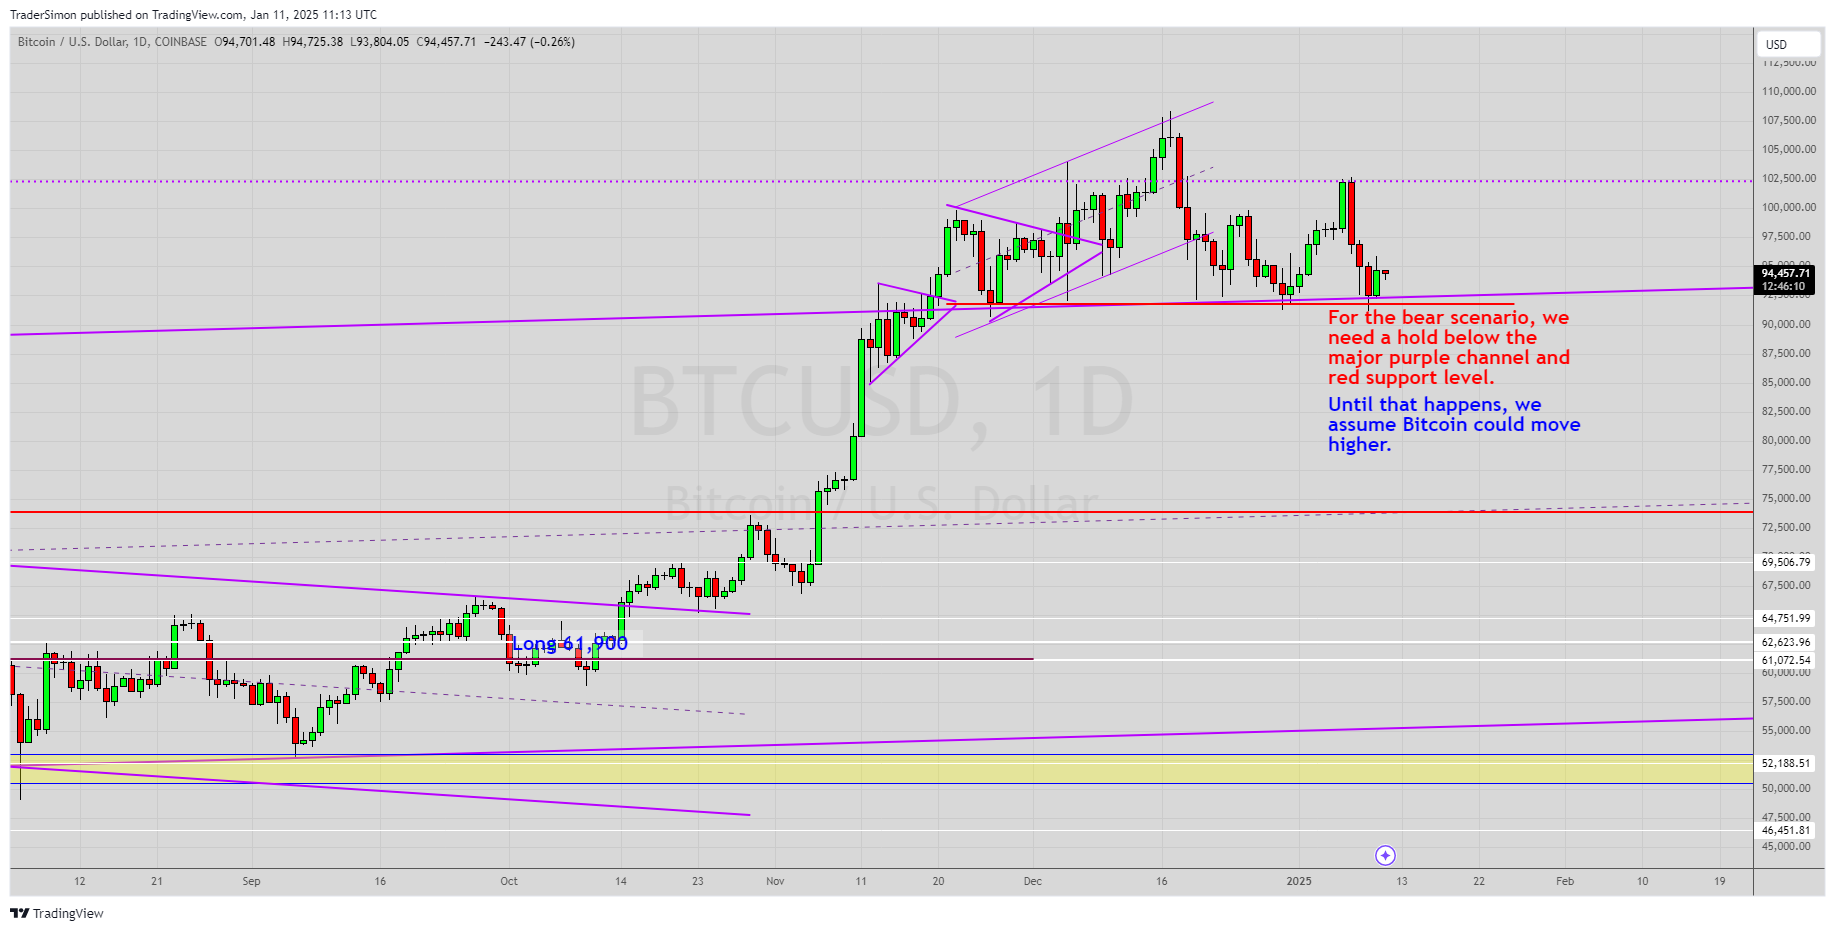
Since December, the market has been unable to break the fib level and has made six attempts to break support at 92k. This support level is formed by the top of the monthly purple channel and immediate lows on the daily chart.
So, we will assume Bitcoin could move higher from here until support is broken, but… any hold below support for a decent period of time could mean we enter a major bear move.
This won’t be the end of Bitcoin, but could see a pullback as low as 46k.
More detailed analysis for Bitcoin later in this newsletter, plus we’ll look at the Dollar Index, EUR/USD, Gold, Silver, S&P 500, WTI Oil and Crypto Alts.