


✍️Weekly Trade Plan & Recap 1st - 6th June
How to combine higher timeframe analysis with lower timeframe price action for a winning S&P 500 trade! Plus Trump's latest tariff announcement and what that means for Gold.


How do you combine higher timeframe analysis with lower timeframe price action for a winning S&P 500 trade? Our latest win provides a good working example:
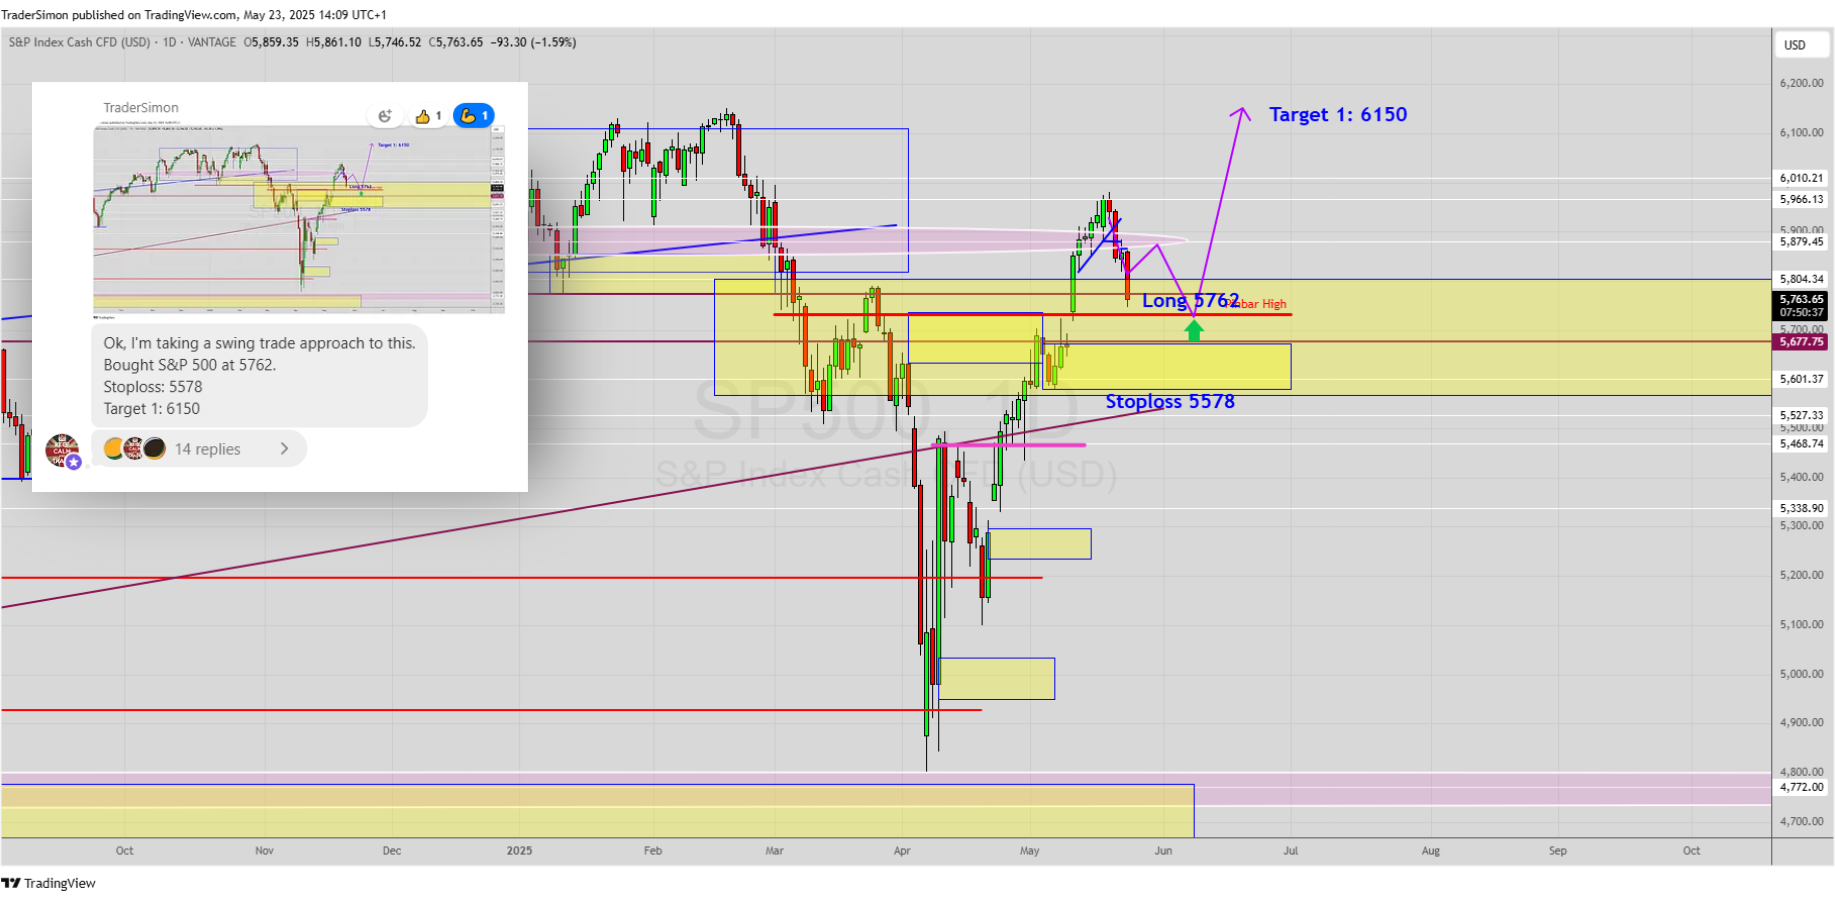
Two weeks ago, I published the following analysis and monthly chart to Substack members. The S&P 500 had printed a huge monthly Pinbar into support and breached the Pinbar to the upside.

Technical analysis doesn’t get simpler than this and you’d be surprised how well concepts such as Pinbars and Support & Resistance work on a weekly or monthly chart!
After the breach of the Pinbar, we were waiting for a pullback to the high of the Pinbar at 5733 to enter a long position.
In fact, price came very close to the level - the low was 5746 and I got an entry at 5762. That’s not a huge difference for the wide swings we have been witnessing recently in Equity markets.
Here’s the original call to Substack members, showing my entry, stop and provisional target. I say “provisional target” because I will often change targets as price action and structure unfold.
Now let’s turn our attention to the lower timeframes. What gave me the heads up to call the trade earlier than the original planned level?
Well… look at the 5 minute chart. Can you see the Demand level (characterised by a fast impulse) where price reacted and turned back up?
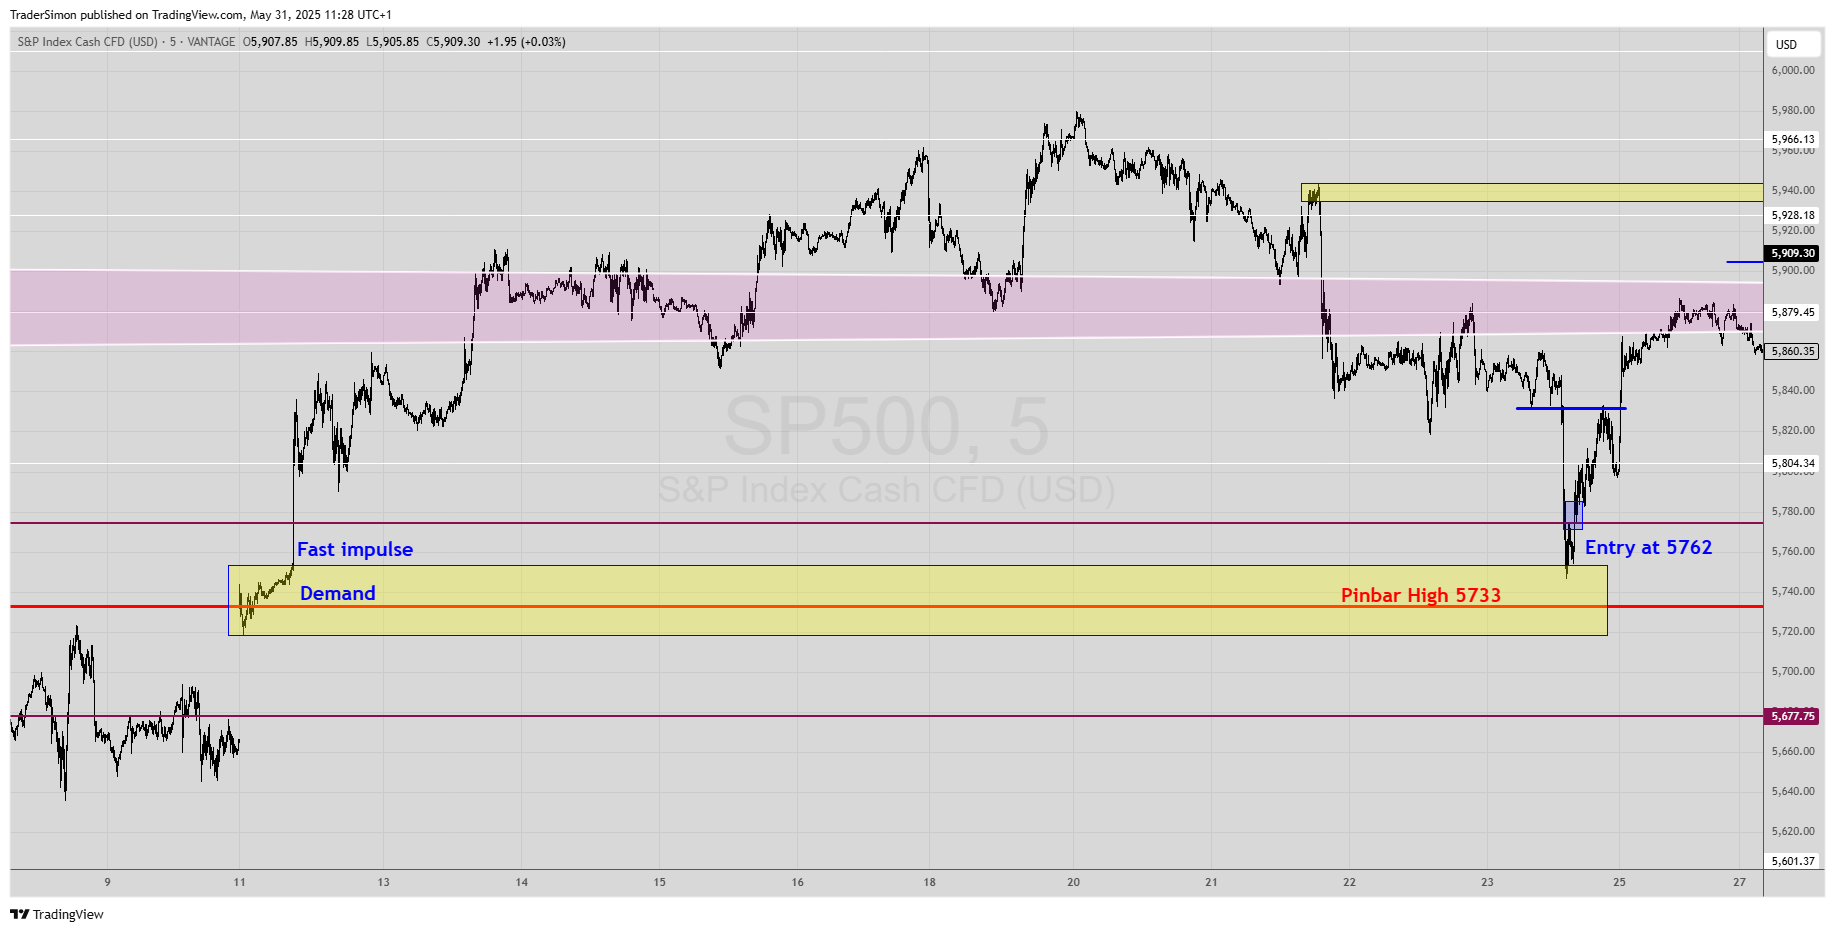
Zoom in to the same chart below and we can see wick rejections at the Demand Zone. That was our clue that price could hold.
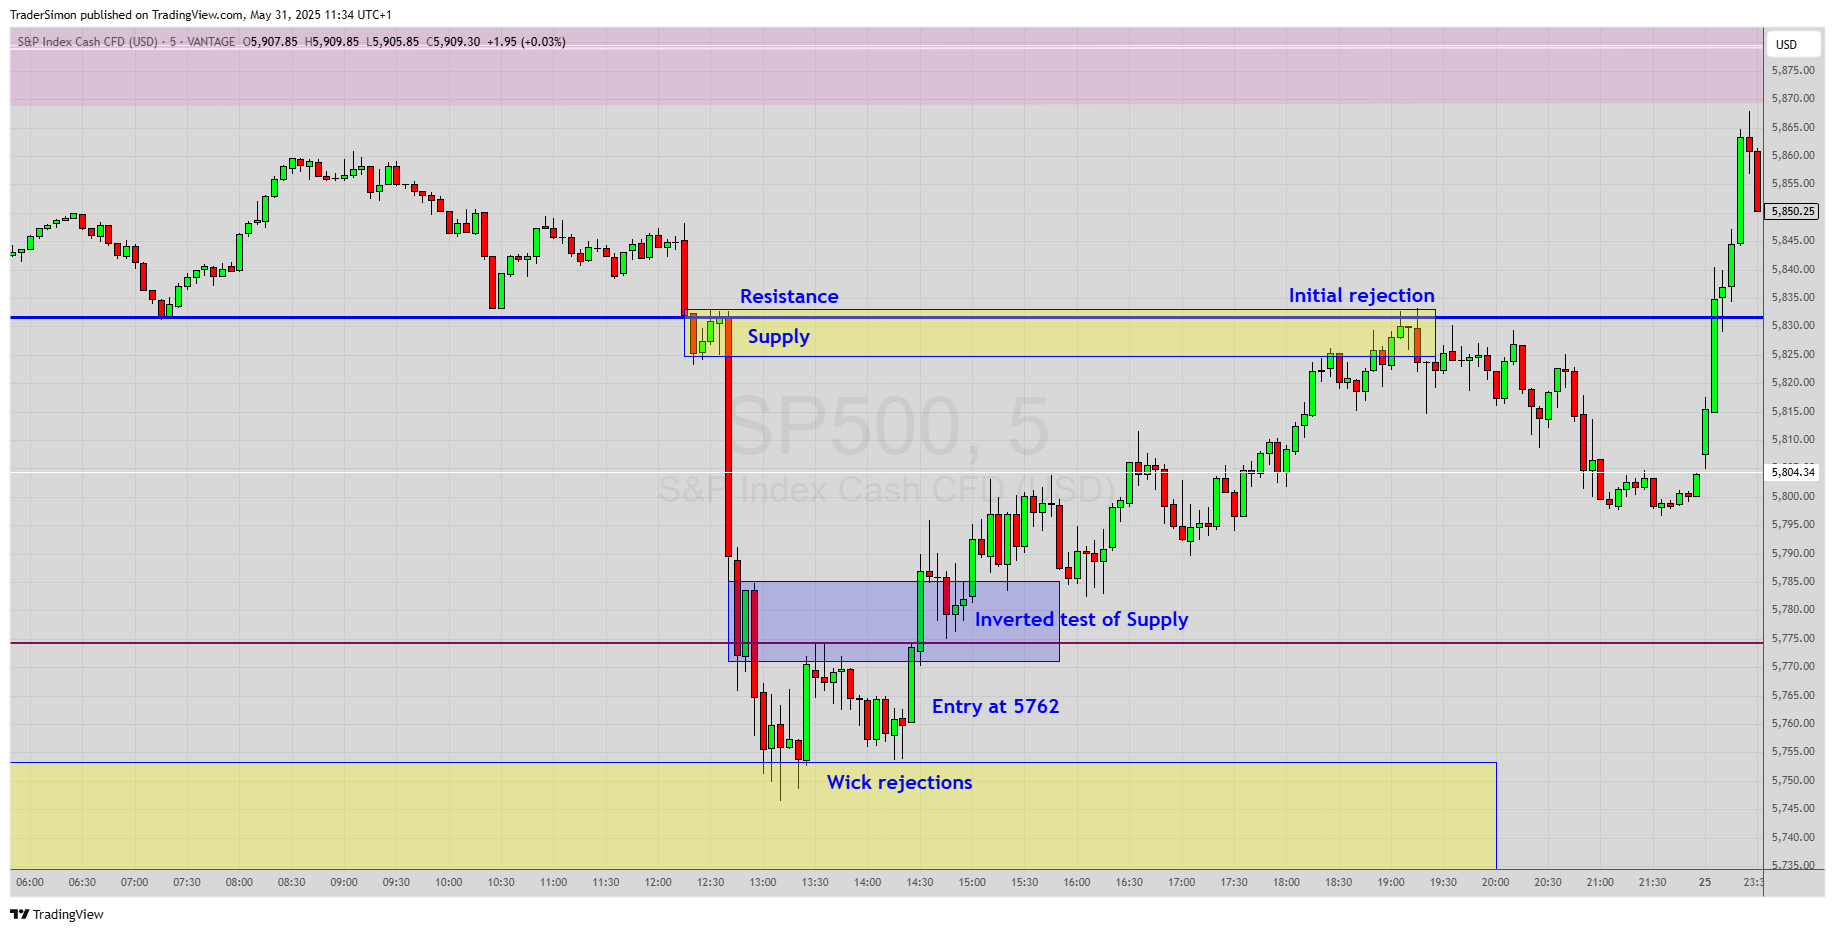
After the entry, the market broke up through Supply and retested the top-side. That break of structure gave further confidence to stay in the trade.
And finally, I expected the small Supply Zone and resistance level to send price back down a little. That may have scared you into closing the trade and it’s at times like this we need to remember the original higher timeframe reason for the trade to maintain confidence in the setup.
Finally, we scaled some profit earlier than the original target.
The first was a 50% profit scale at 5929, just before small Supply Zone.

The second scale took 25% off at 5979 which was perfect timing as the market dived back down soon after. 25% of the position remains active with a breakeven stop, to capture further possible upside.

For further analysis on the S&P 500, continue to the member’s section of this newsletter. We’ll also cover our current Gold and Copper trades and what the latest Trump tariff announcements could mean for these positions. Plus regular analysis for the Dollar Index, EUR/USD, Gold, Silver, Copper and Bitcoin.