


✍️Weekly Trade Plan & Recap 22nd - 27th June
A winning Euro trade and next profit targets. The amazing coincidence on the S&P 500. Plus regular analysis for the Dollar Index, Gold, Silver, Copper, Platinum, S&P 500, Bitcoin, Pepe and Ethereum.


Despite the eagerly awaited FOMC last Wednesday. it was a very quiet week.
However. we did manage to get onboard a EUR/USD long and scale some profit before the close on Friday.
This is the moment I called a Euro long in the Substack chat…
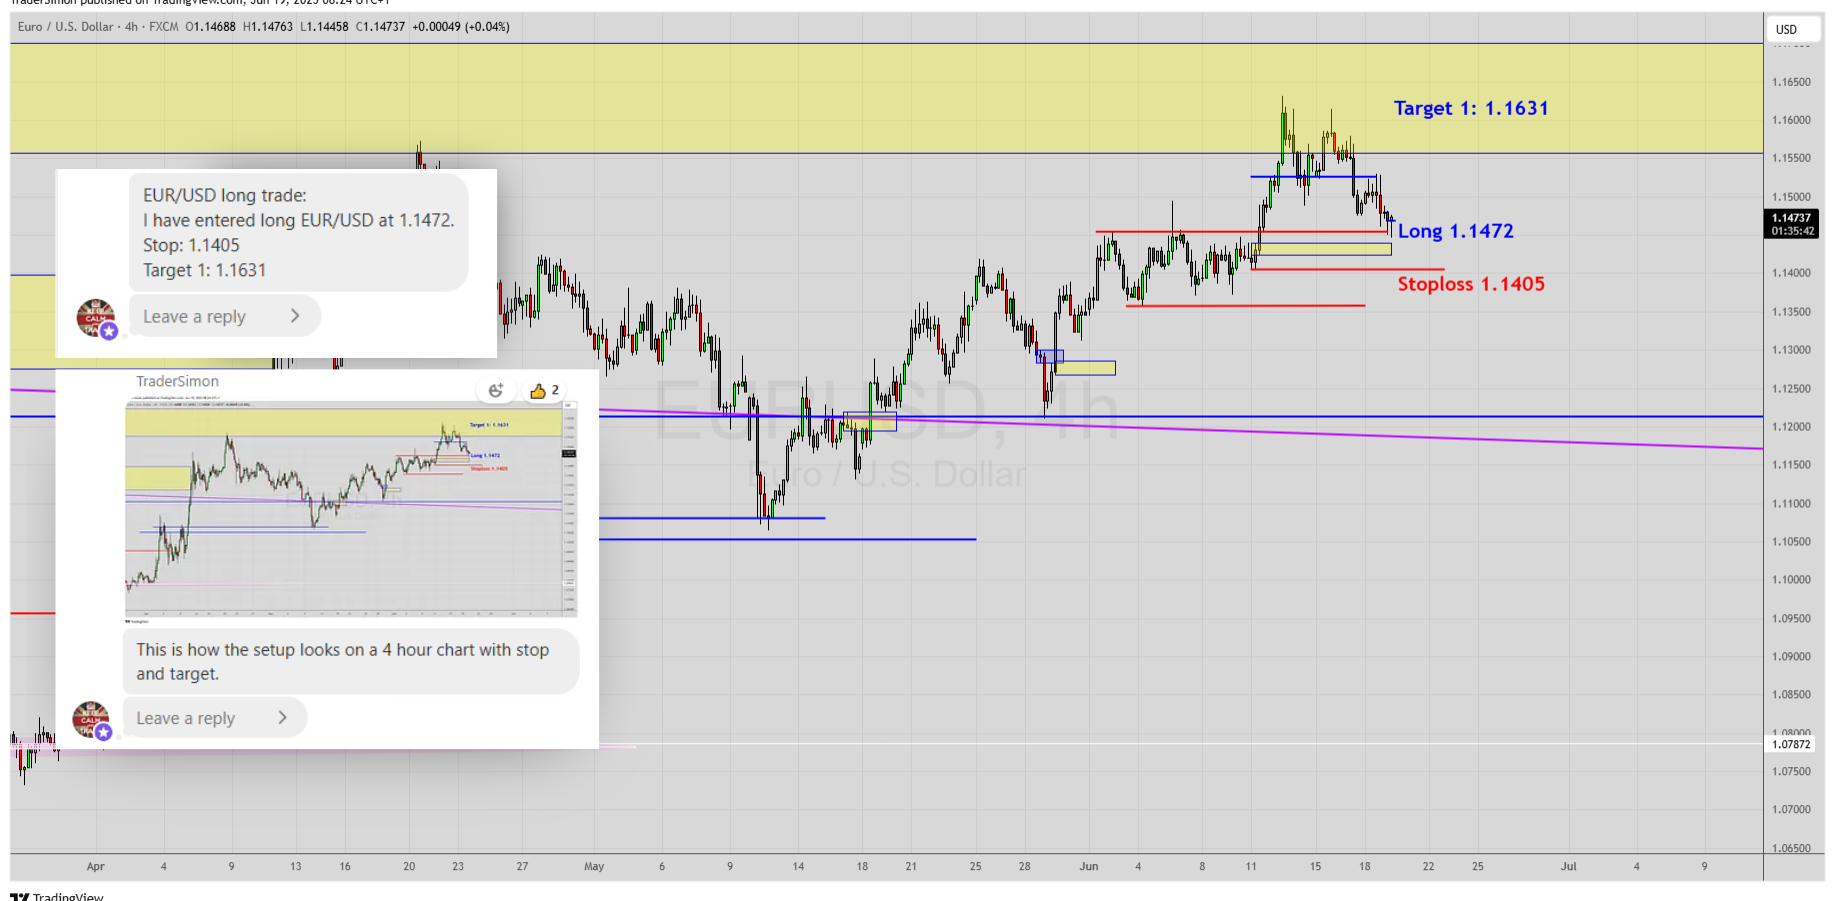
… and as the week started drew to a close, we scaled some profit ahead of the original target and set the stop on the remainder to breakeven.

Notice on the magnified chart below, the Wedge-like pattern into a strong level of support - that was our signal to get ready for a long.
The eagle-eyed among you will notice we bought into a bearish Supply Zone (yellow box). So why was this ok? …

As always, the answer is on the higher timeframes.
On the daily chart, this is the second time the market has tested Supply and therefore the zone is getting weaker.
Notice also the blue support line at 1.1052 where price bounced. The fact that the move down failed at this first hurdle and could not drop any further was a strong signal the market was heading up.

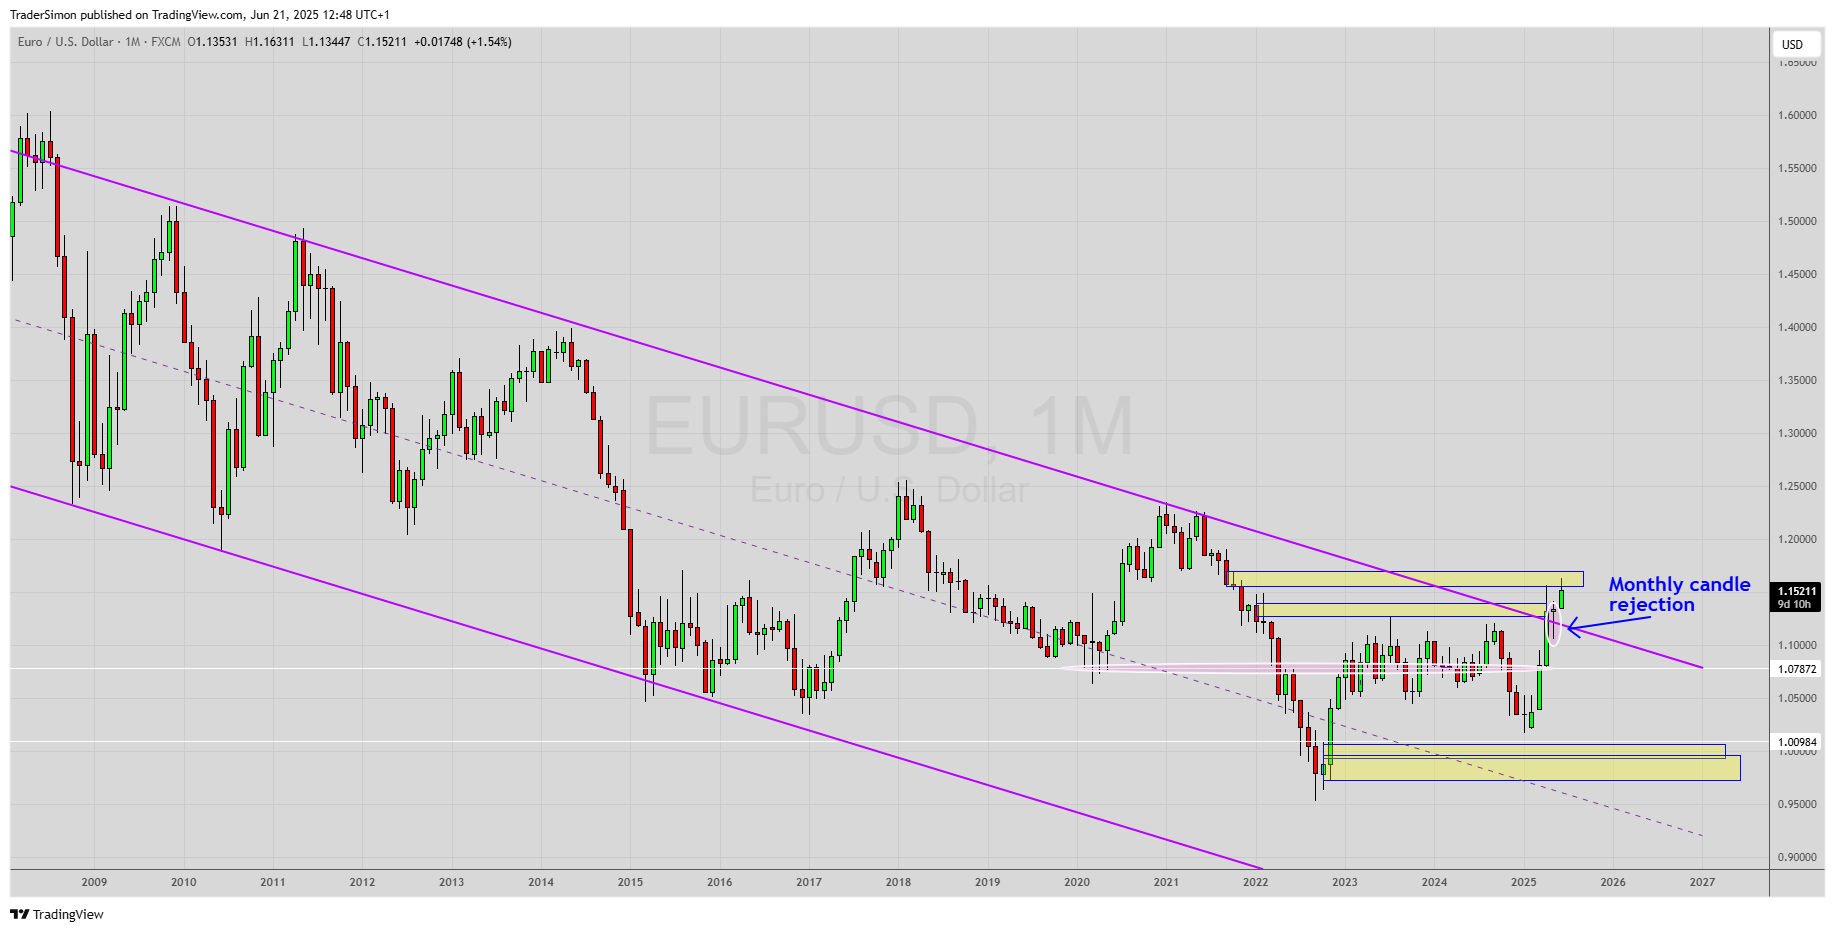
Things really start to get interesting when we look at the weekly and monthly chart and this is where we got our bullish bias from.
The weekly chart show a spike rejection (circled) through support and a purple channel line. It was followed by a second spike (circled) into the top of the 1.1208 support level. Again, all bullish.

That major channel becomes more visible on the monthly chart and you can see how May’s candle formed a wick rejection (circled) into it. This rejection indicates further upside.
If you like my no-nonsense approach to multi-timeframe analysis and would like to see more, consider subscribing to the paid version of this newsletter.
Up next for members, we’ll look at the Dollar Index, Gold, Silver, Copper, Platinum, S&P 500, Bitcoin, Pepe and Ethereum.
Plus… the uncanny coincidence that I found on the S&P monthly chart - you won’t believe it when you see it!