


🎉🎆✍️ Weekly Trade Plan & Recap 31st Dec - 5th Jan
🎉🎆✍️ Weekly Trade Plan & Recap 31st Dec - 5th Jan
How we nailed the WTI Oil short, plus analysis for the Dollar Index, Gold, Silver, Copper, S&P 500 and Bitcoin heading into the New Year.

Last Week’s Highlights
WTI Crude Oil
I really wasn’t planning to trade over the Christmas period, but then WTI Oil set up exactly as per our trading plan and of course, we had to take it!
Last week in the members section of this newsletter, I said the following:
Since the spike of the high at 94, the market has slowly stair-stepped down. Not even trouble in Israel and Palestine could reverse Oil - the best it could do was form a Bear Channel which broke down again.
Here’s the chart with annotations showing exactly what I meant:

With that in mind we were looking for a short setup at an area of confluence on the 4 hour chart, which I called in the Substack chat at 75.08.

By the end of the week, we had scaled 50% of the trade at target 1 and moved the stop on the remainder well into profit.

For those working on their discipline and patience, whether it reaches final target or not, this is an example of a perfectly planned trade (and a lot of waiting) for the market to reach a level spotted 2 weeks ago.
In the member’s section we’ll look at the lower timeframes for WTI and explore how they signaled the turn.
The Dollar Index (DXY)
Last week I finally got stopped out on the Dollar Index long trade.
Luckily it was only a half size position as I was waiting for price structure to confirm another entry - which never happened.
Here’s the original half size entry at the top side of a higher timeframe triangle with a stop below.
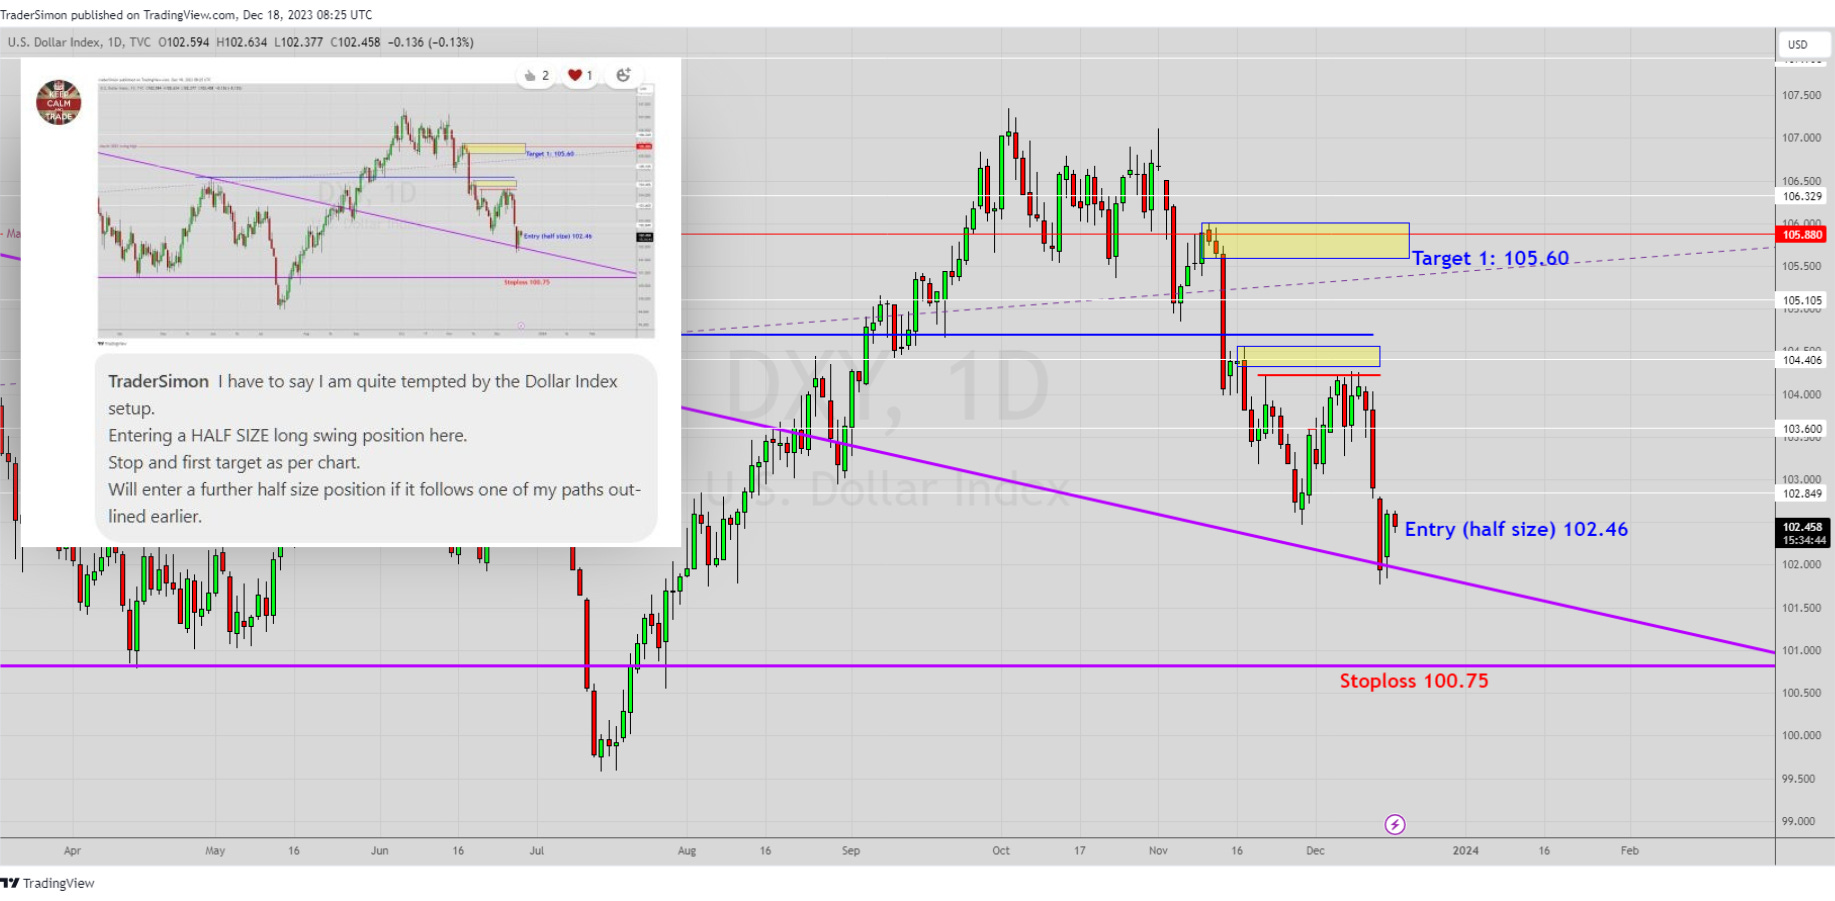
… and here’s where I got taken out at my stop loss. A bit unlucky really, as it bounced as soon as it hit the lower line.

All in all, it was a profitable week, with the WTI Oil trade more than making up for the half size loss on the Dollar Index.
Next up for members… market analysis for the New Year, including what we can expect from the Dollar, Gold, Silver, Copper, S&P 500, WTI Oil, Bitcoin and WOO/USDT. 👇🏼👇🏼👇🏼