


✍️ Weekly Trade Plan & Recap 4th - 9th Feb
✍️ Weekly Trade Plan & Recap 4th - 9th Feb
Did the S&P 500 just signal a reversal on Friday? Plus analysis on the Dollar Index, EUR/USD, Gold, Silver, Copper and Bitcoin.

Last Week
In the previous newsletter, I mentioned last week would be a rollercoaster ride, with multiple major news releases and it certainly was!
Let’s review what happened…
EUR/USD
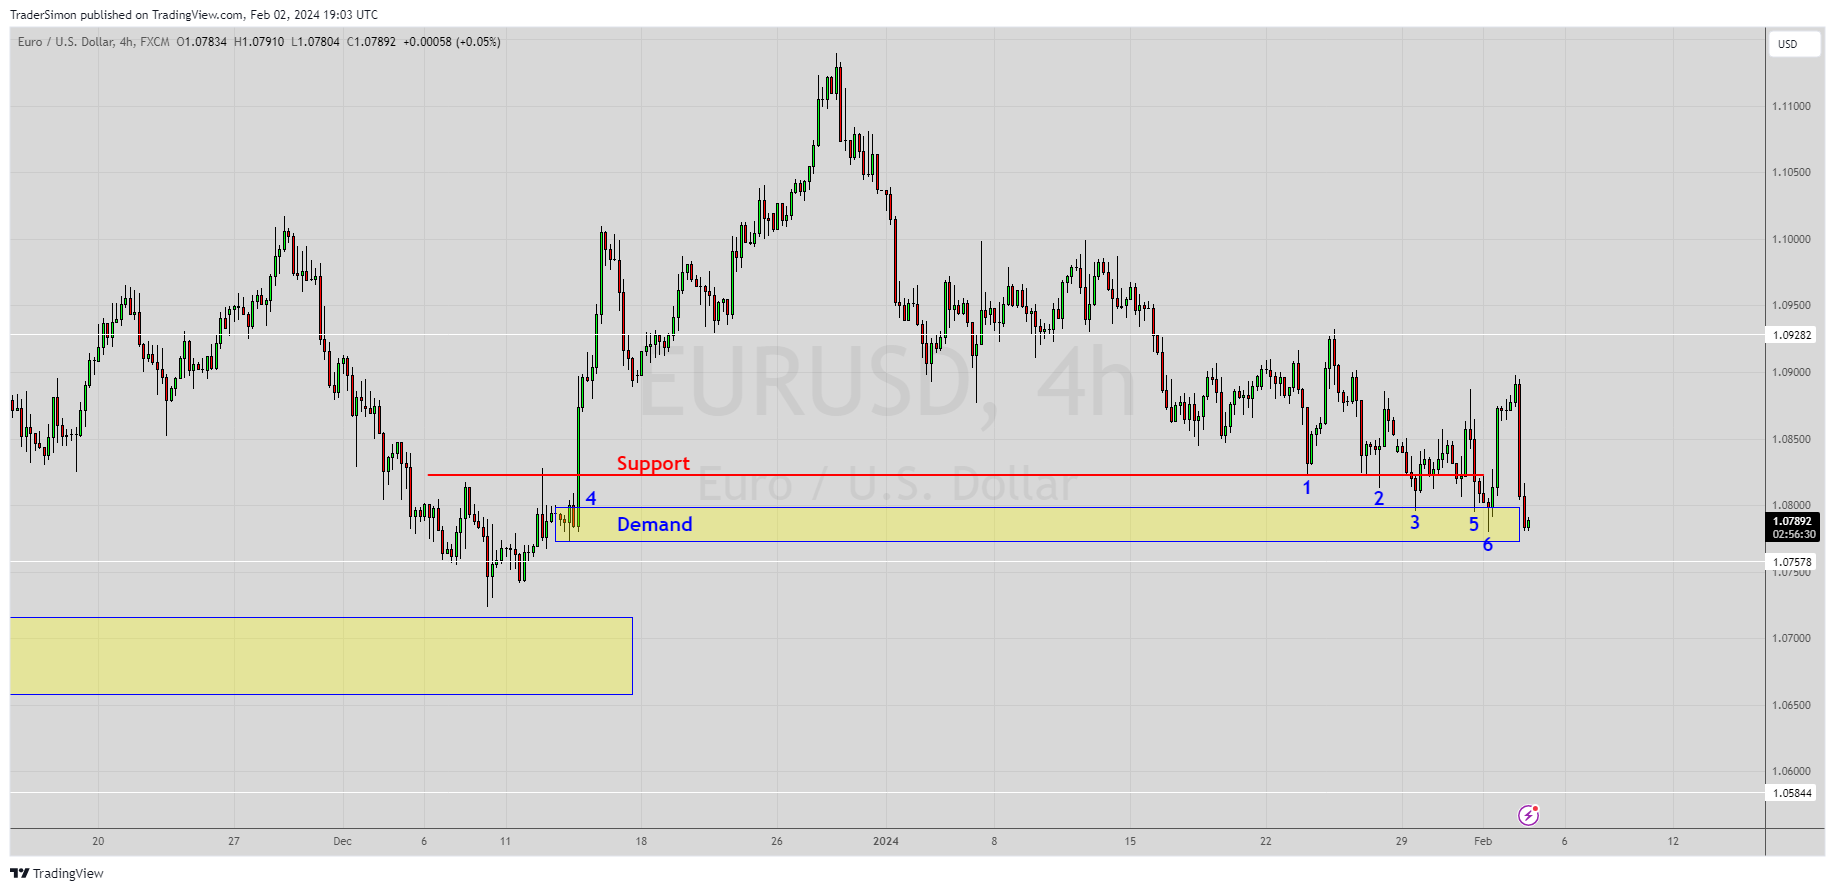
I attempted a long on the EUR/USD near Demand, but ended up closing for only a small profit the next day. It’s a pity, as it did continue up.

Despite the missed profit, we can still learn something from the chart - I’ve marked some numbered points on the same chart below.
Notice how price first bounces at support (1). The second time back it spikes through support (2) and bounces again.
The 3rd test is a proper first test of Demand (3). Look left and you will see this is the exact point (4) where the fast move up started.
Points (5) and (6) were further tests of Demand. Note that each test is lower than the previous (even if only by a pip for number 5) - this is how the market reaches for liquidity.
I generally won’t take 3rd tests of Demand zones (6) because more often than not they will fail, but in this case it surprised us all by producing the fastest and furthest move up. That’s the exception rather than the rule, which I have found after observing these markets for many years.
S&P 500
A loss that could have been avoided last week was a day trade on the S&P 500.
I had shorted a spike and reverse of the red line (circled), just a bit before Supply. The market started to move down as expected, but it turned again at the bottom of the channel.
Price started retracing and I stayed with the trade. The 2nd spike gave hope that this may have been a deeper test of Supply, but finally I was taken out.
The Supply zone then became support for a further move up.

It’s a reminder to myself to be more ruthless with day trades. The stoploss should have been set to breakeven when the market hit the bottom of the channel and I could have scaled some profit or at worse, taken breakeven.
Depending on whether a trade is a scalp, day trade, swing trade or investment will determine how closely that trade is monitored, how quickly the stoploss is moved and how quickly profit is taken. This graphic illustrates my point:

We’ll cover the outlook for the S&P in the members section of this newsletter, with a potential long-term reversal play if structure confirms.
Silver
A fortnight ago, I published this Silver long trade taken in line with our bullish bias.

The trade looked good originally, but came right back to my breakeven stop during last week’s choppy price action (below).
You’ll notice that it subsequently bounced from my red line, so if one thing was to be said about last week, my levels have been spot on!

A Note On Twitter Traders
One of the fallacies of watching so-called “traders” on Twitter is to believe that trading is easy. Everyone wants to be a hero and ego prevents Twitter traders from publishing a truthful account of their trading. This is damaging not only to themselves, but to their followers who want to compare how their own trading is progressing.
I do believe it’s important not to “sugar coat” trading and I will always present a true picture of what trading involves in this blog.
OK, enough said! … Let’s move on to the analysis for this week. We’ll look at the Dollar Index, EUR/USD, Gold, Silver, Copper and Bitcoin. 👇🏼👇🏼👇🏼