


✍️ Weekly Trade Plan & Recap 5th - 10th November
✍️ Weekly Trade Plan & Recap 5th - 10th November
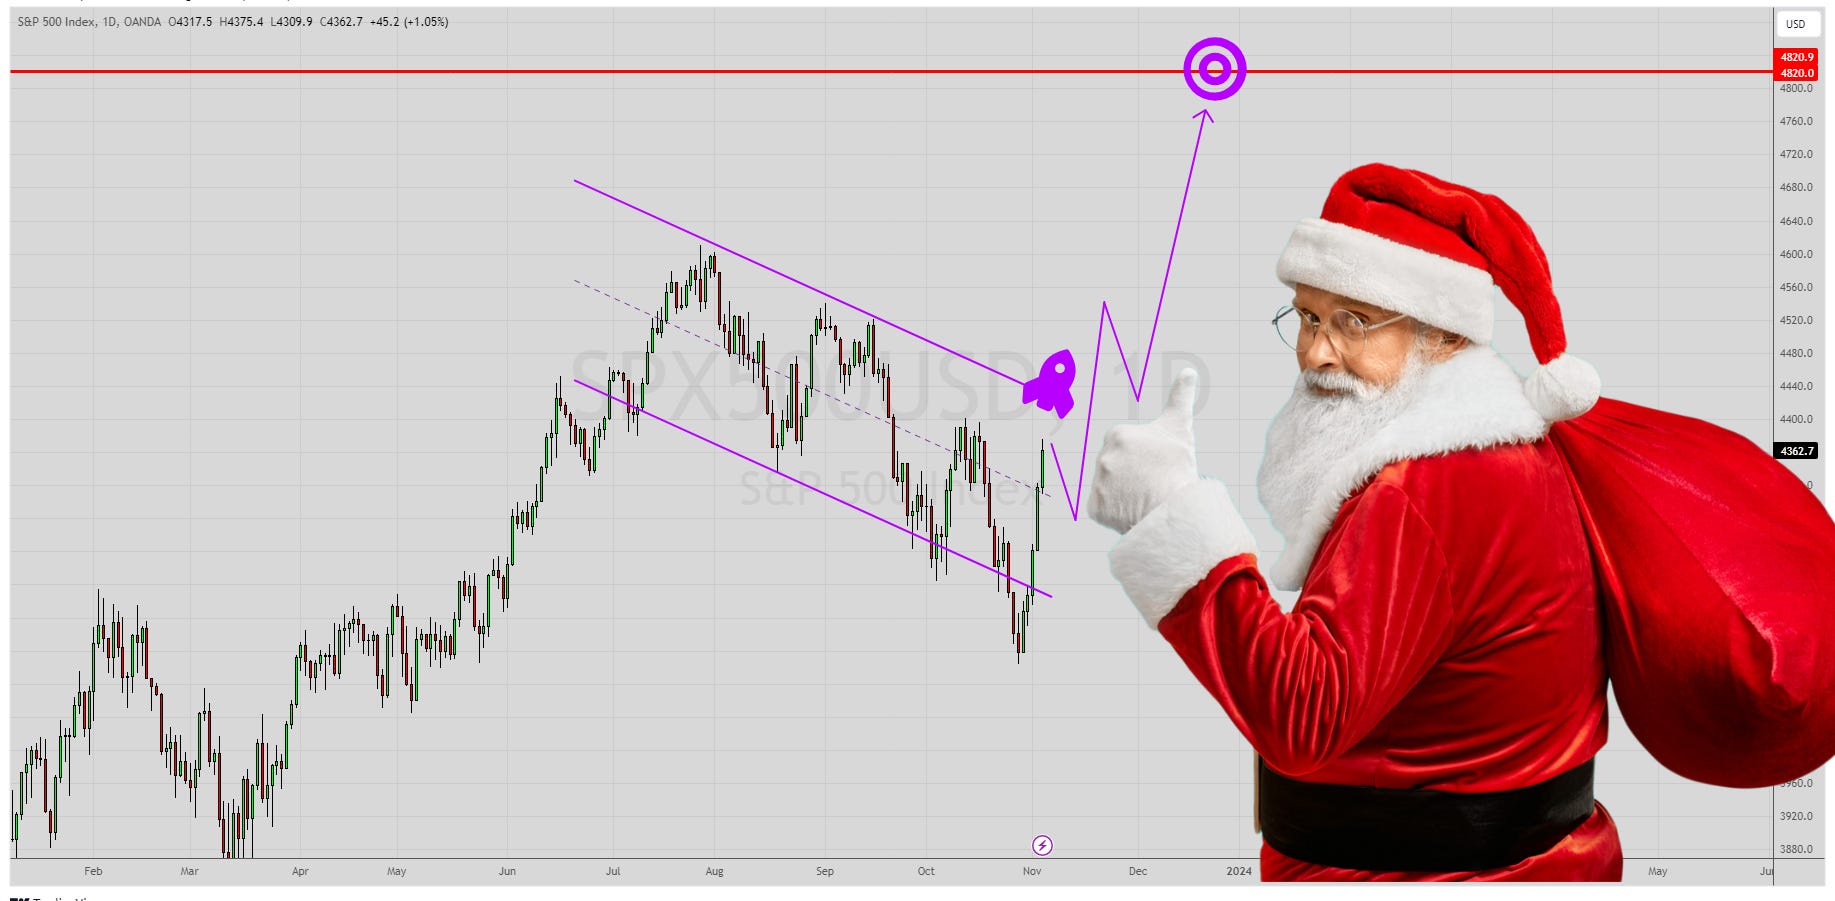
How we predicted the S&P bull move. And could this be the start of a Santa Rally?

Last Week’s Highlights
It was starting to look like a boring week last week, with no trade setups after FOMC and a couple of scratch trades on Cryptos, but then this happened…
The S&P printed a channel fake-out just below support and started to climb back inside:
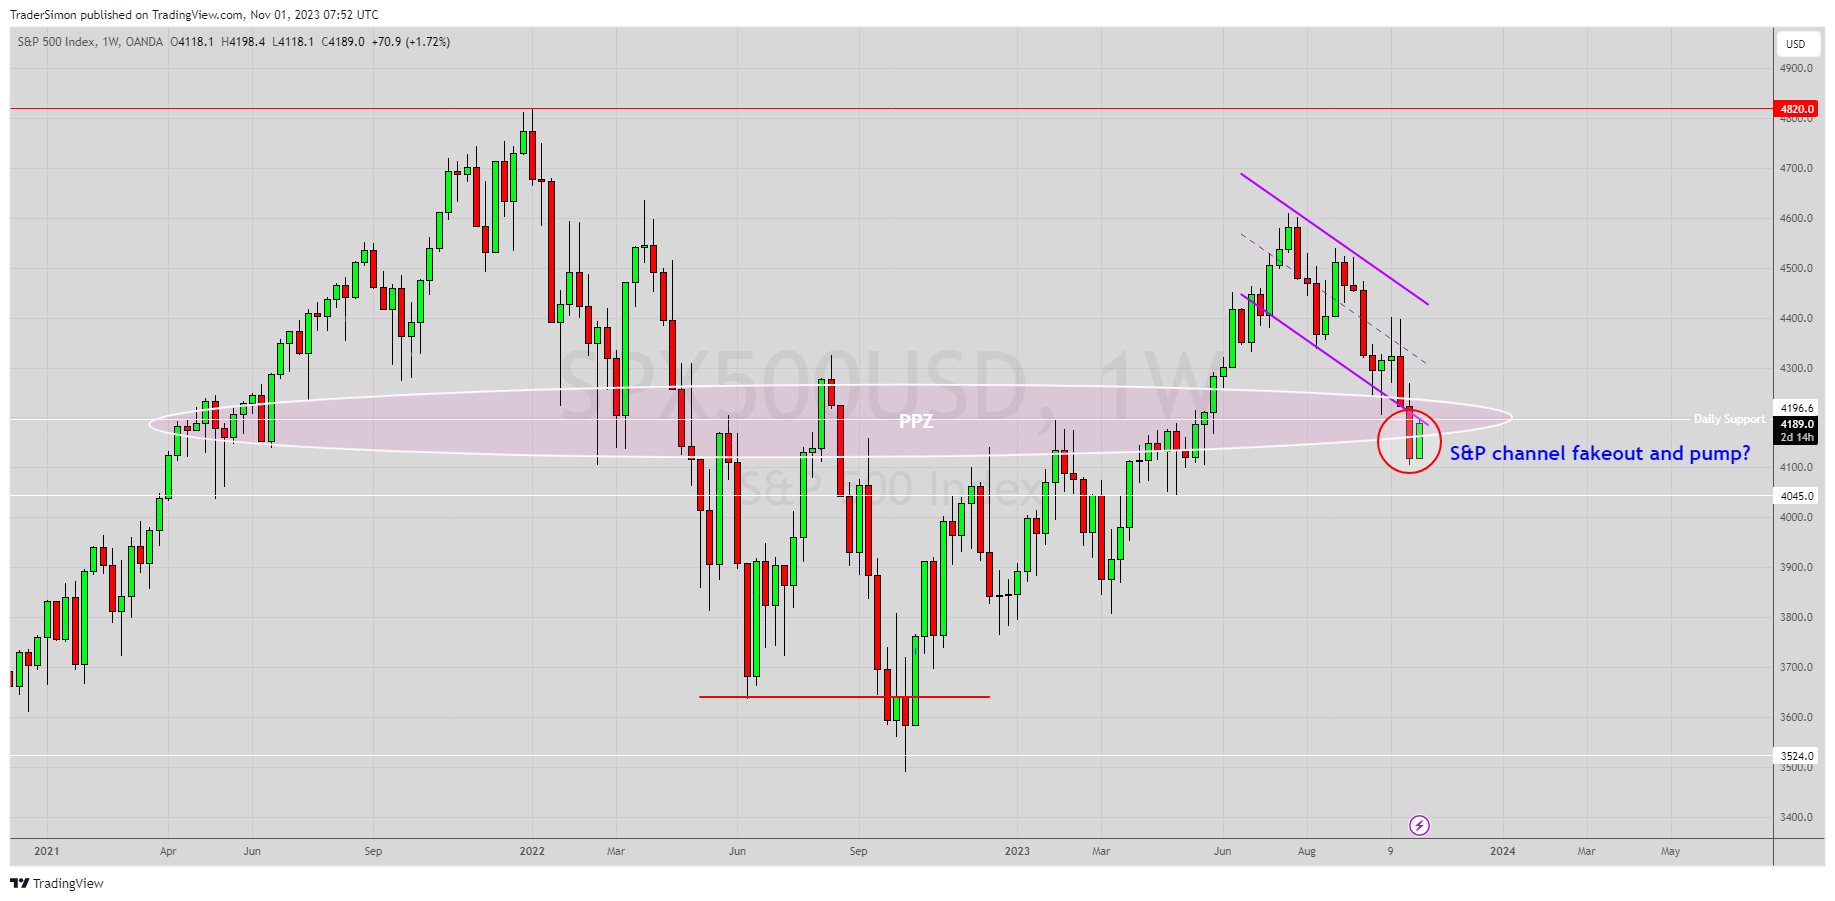
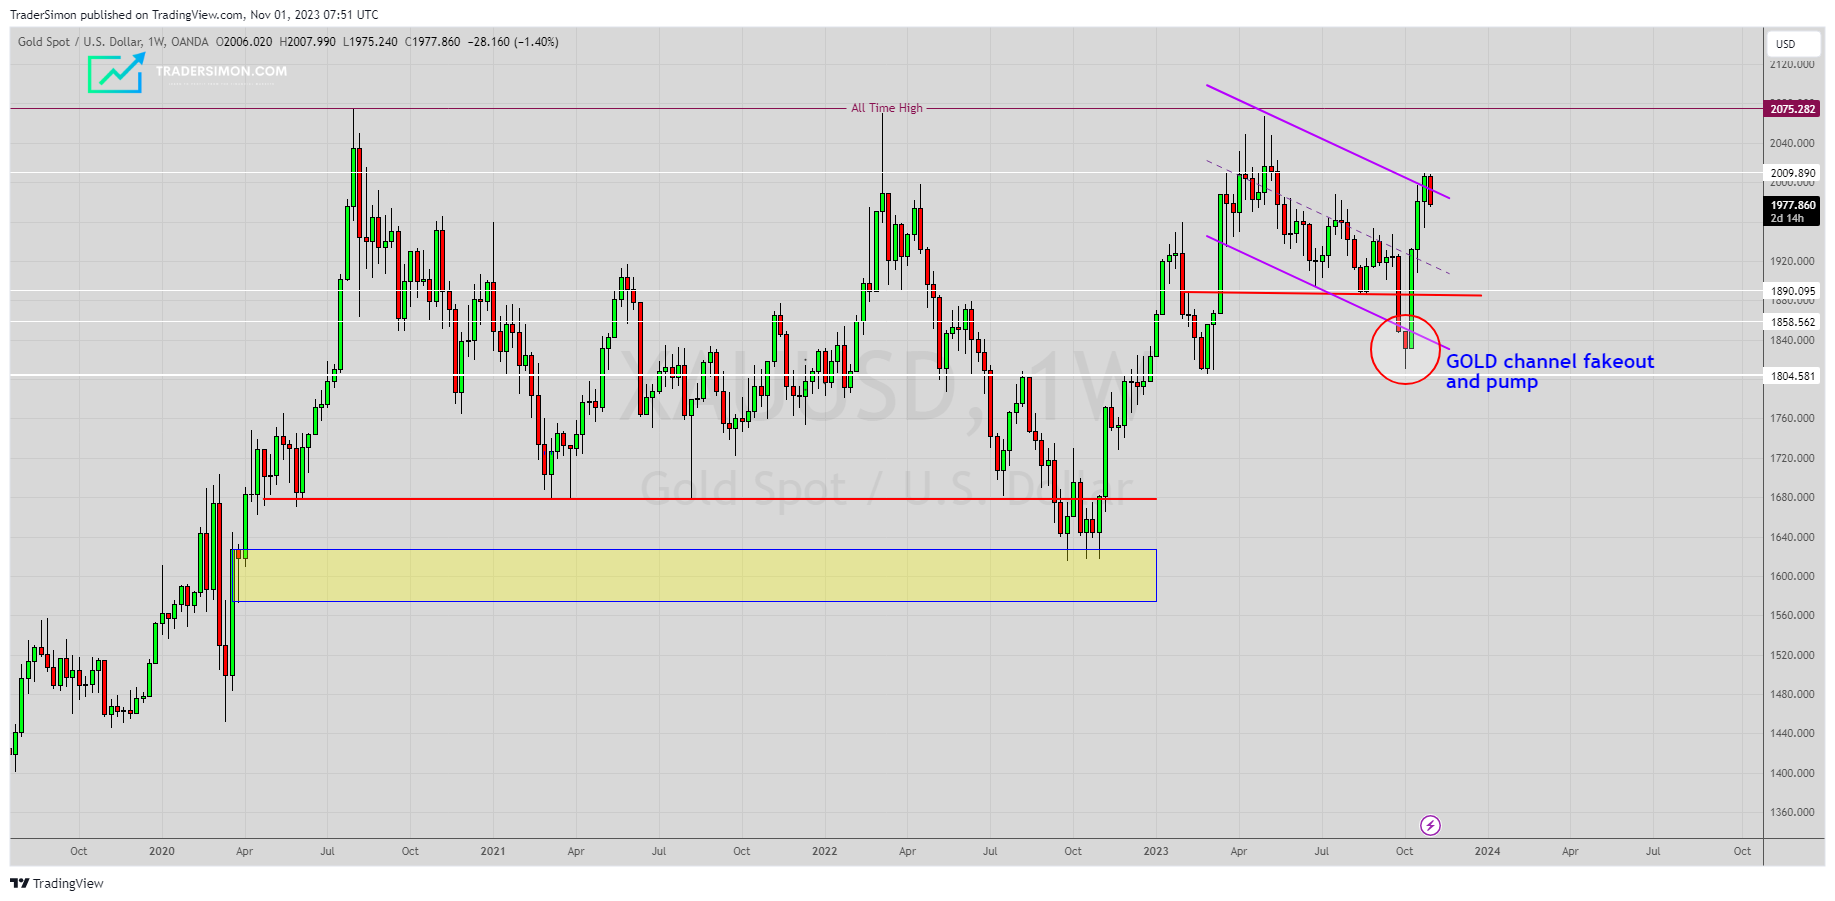
I commented how similar this was to the Gold channel fake-out from 4 weeks ago - and yes, we’re still holding 50% scaled long positions on Gold and Silver!
With that in mind, I published this S&P long momentum trade for members on Substack with an entry at 4258.
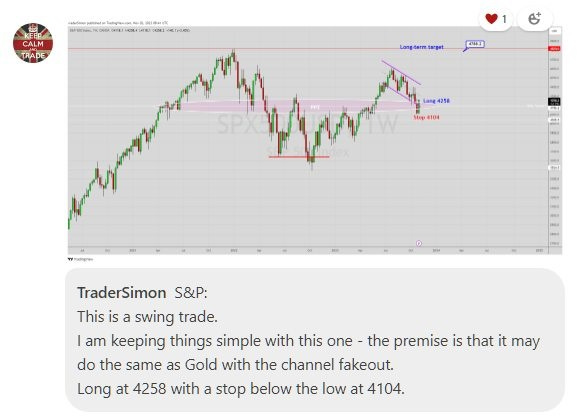
We took profit at 4341 and 4367 and are flat over the weekend. That’s a decent average profit of 92 points.


For the more aggressive trader, there were around 170 points available if you initiated the trade before FOMC.
Notice on the chart above, that we actually traded through a Supply zone - and that is a handy reminder not to indiscriminately trade every “yellow box” on a chart. In order to trade successfully, you must understand Bias, context and price structure.
Santa Rally?
With the backdrop of Middle East war and traders on the edge of their seats waiting for a Black Swan event, you would think that equities would crash big time.
However, the market loves to fool the crowd. Think of the market as a game controlled by the powerful Elite on higher timeframes and Algos on lower timeframes. The market doesn’t always follow rational thinking.
With that in mind, looking at current structure and price action, it would not surprise me if we were too see a Santa Rally towards the end of the year, squeezing out traders who are currently short and possibly reaching the old high.
We’ll look for opportunities to get long the S&P in the analysis section and I’ll explain my rationale behind the bullish prediction.
Let move on to this week’s analysis and we’ll cover the DXY, EUR/USD, Gold, Silver, S&P, Dow Jones, WTI Oil and Bitcoin for members… 👇🏼👇🏼👇🏼