


✍️ Weekly Trade Plan & Recap 5th - 10th January
Last year's yearly candles have printed. But what does this mean for the Dollar Index, Euro, Gold, Silver, S&P 500, WTI Oil and Bitcoin in 2025? Read on, to find out more...

Now the Christmas and New Year celebrations are over, traders return to their desks and it’s time to get back to the markets!
In the first newsletter of the year, we’ll take a top down approach to the markets, starting with the yearly charts. We’ll look at the Dollar Index, EUR/USD, Gold, Silver, WTI Oil, S&P 500 and Bitcoin.
Note: I am writing some of this analysis on Friday afternoon, so the charts may look a bit different by the time the market closes.
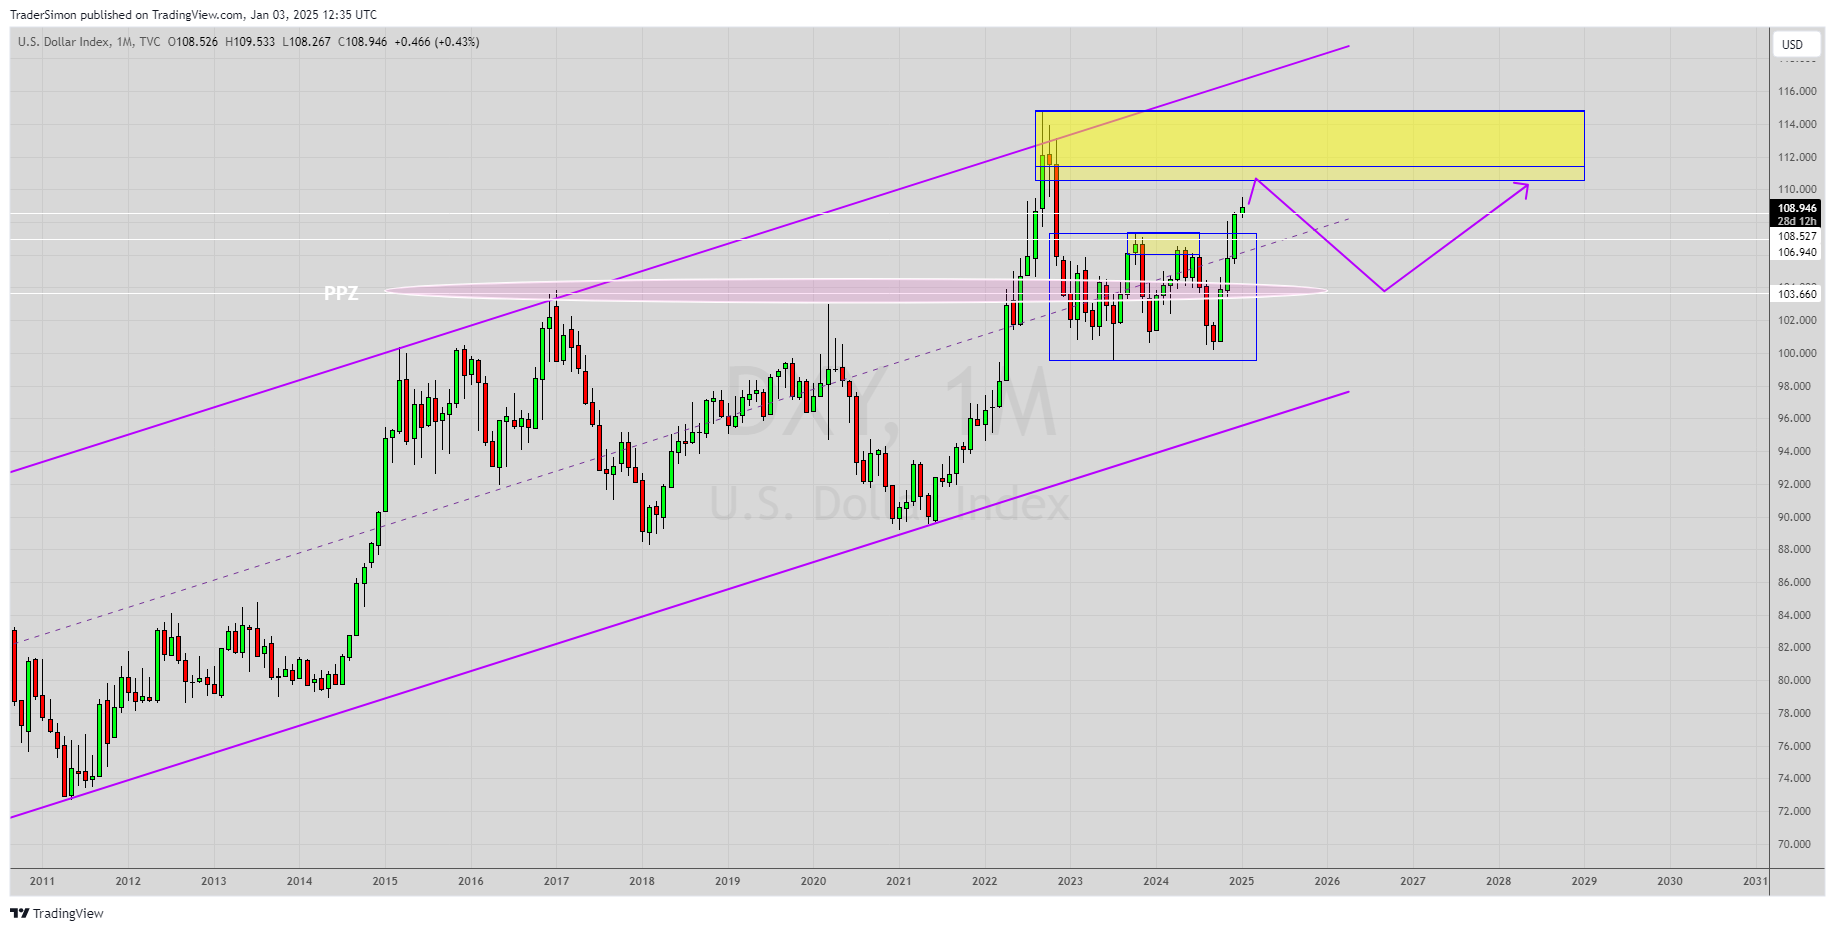
The Dollar Index (DXY)
Since the stock market crash of 2008, the Dollar has actually been in an upward trending channel on the yearly chart.
However, as we know, markets do not move in straight lines and support/resistance areas are often retested.
Looking at the yearly chart, it would not surprise me if the Dollar pulled back to retest the major Price Pivot Zone around 103.66 (circled), before moving higher.

On the monthly chart, it’s possible we get a small move up to monthly and weekly Supply and then a drop from there.
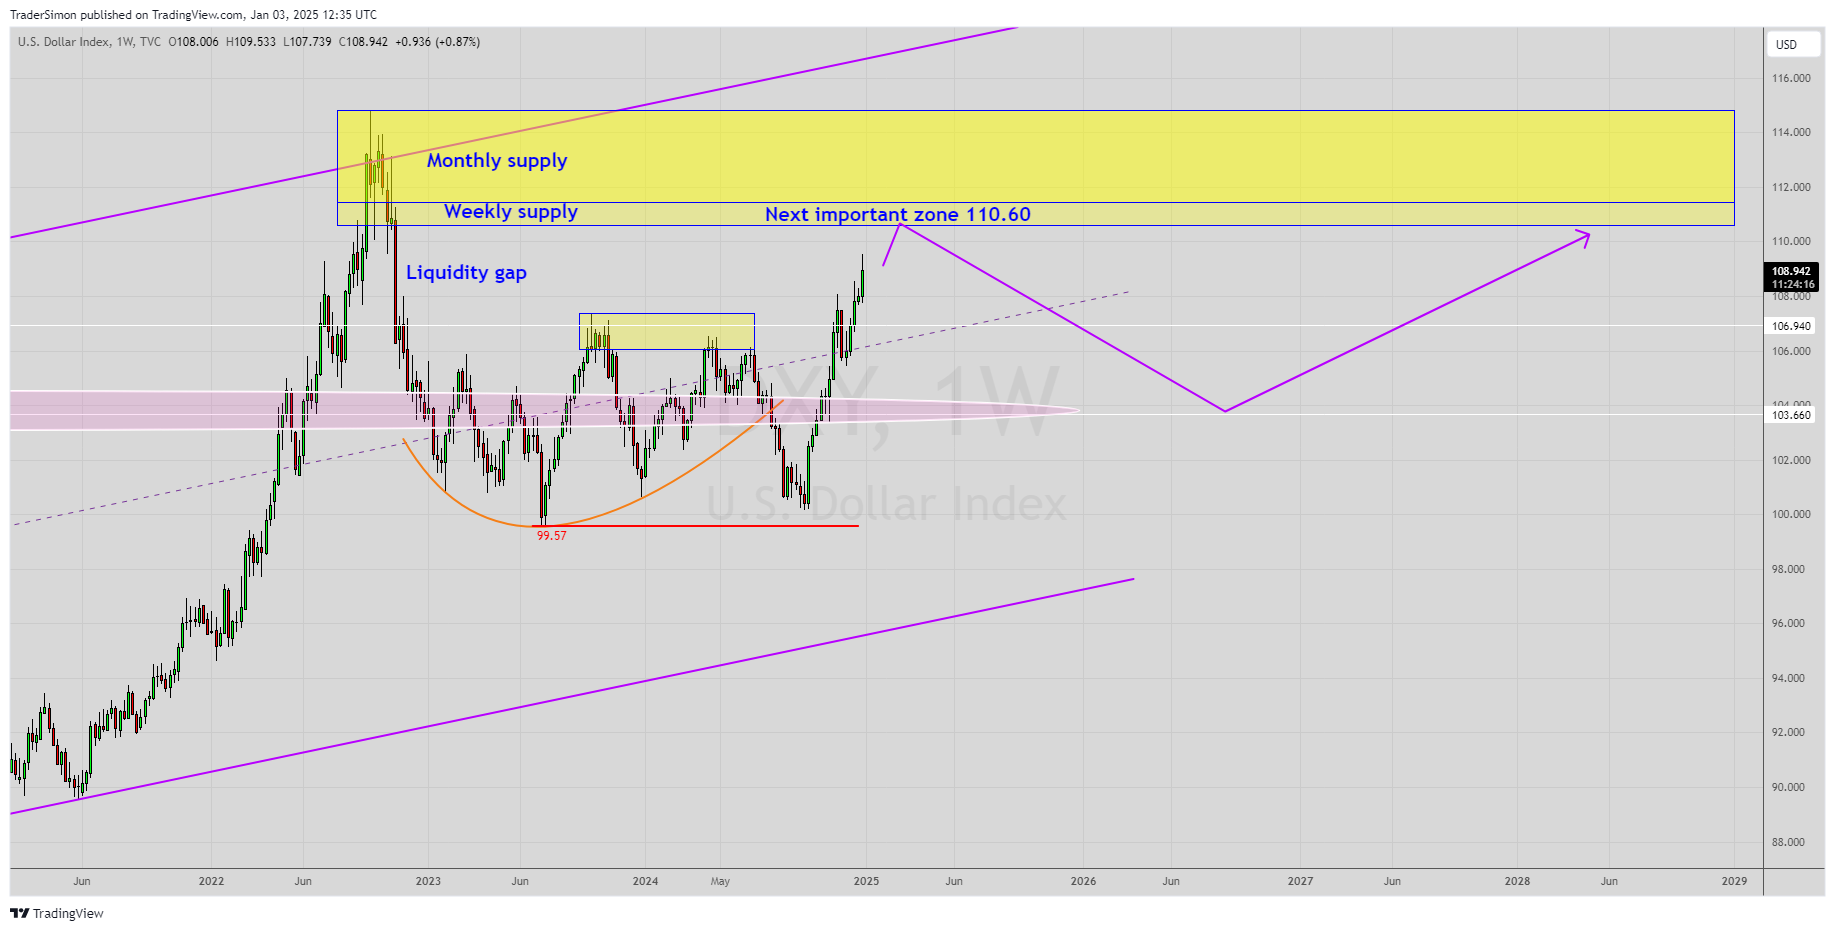
As I’ve said in previous newsletters, the liquidity gap to the left (on the weekly chart below) is quite likely to be filled, and therefore I prefer a move up to Supply at 110.60 first and then a drop to retest the Price Pivot Zone at 103.66. From there, we can look for longs.
The next bit is for members only! Consider subscribing to this newsletter and get the full analysis every Sunday before the market opens.