


✍️ Weekly Trade Plan & Recap 6th - 11th October
Analysis and trade plans for the Dollar Index, EUR/USD, Gold, Silver, WTI Oil, S&P 500, Dow Jones, Bitcoin, Dogecoin and Chainlink.

Last Week
The ranging and choppy price action caught me out last week with a loss on the Dow and S&P.
The Dow gave a sharp “V” reversal, which looked good for a long. Here’s the original chart with two scenarios…

… unfortunately the Dow had other ideas and headed straight back down!

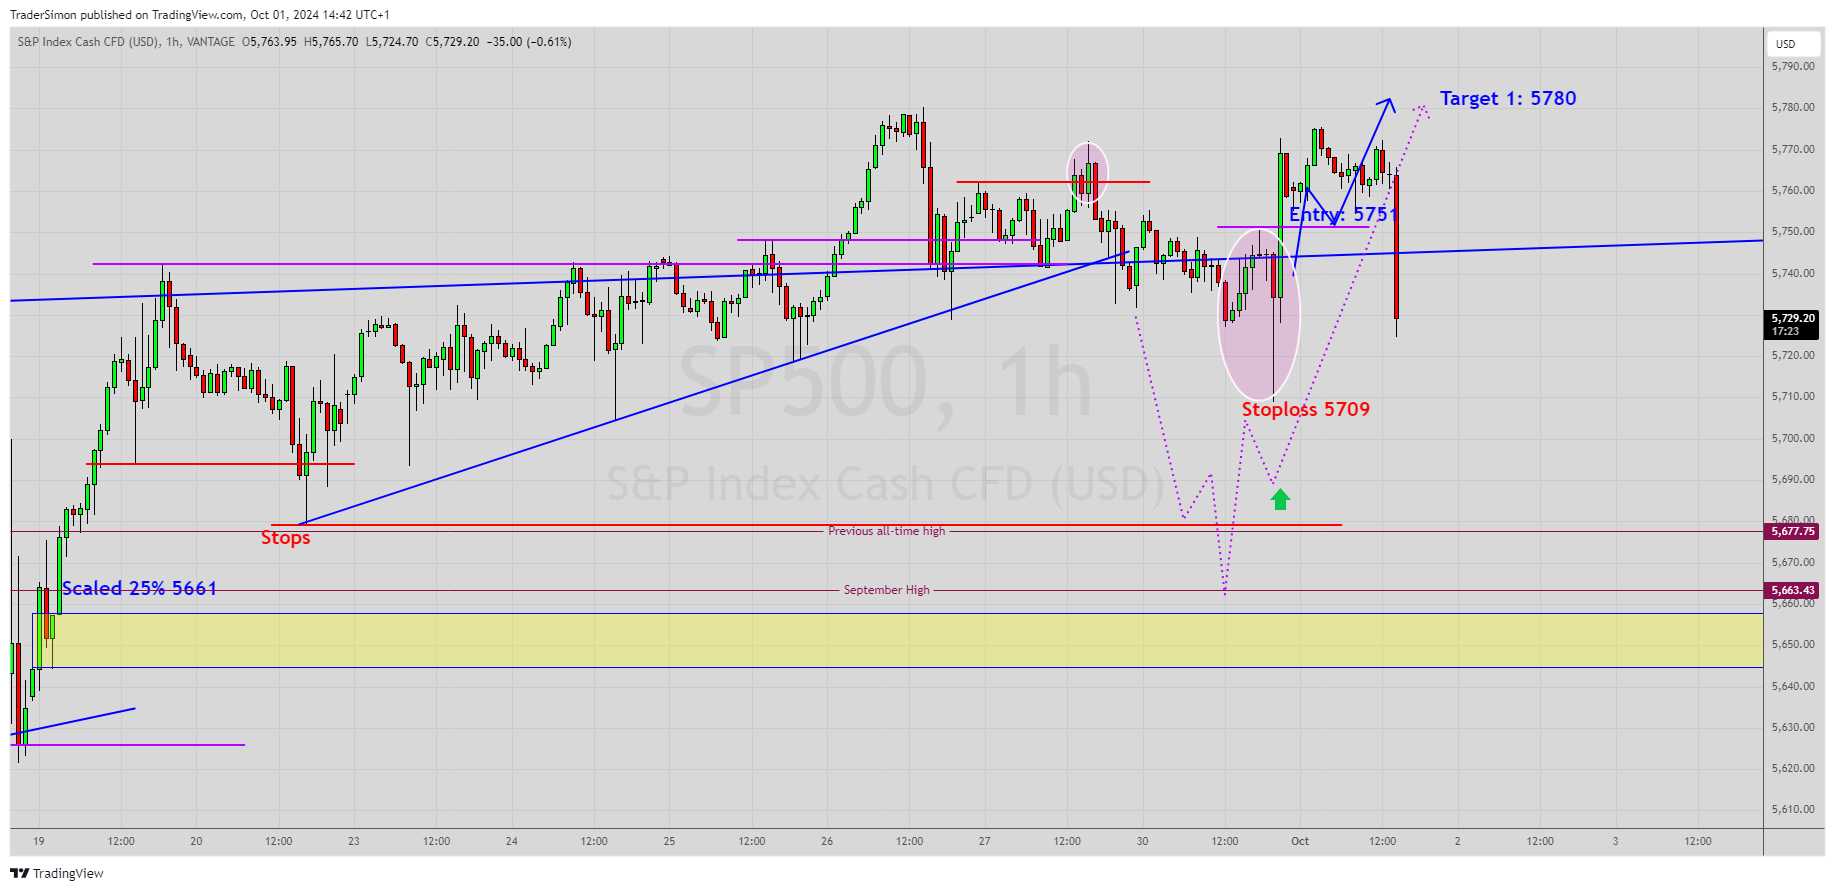
I also gave two scenarios on the S&P and was filled on a Buy Stop, as per the chart below:

… that was a bit unlucky, as my first target was missed by 5 points and the S&P made a sharp drop, just like the Dow.
Note: Some trading services only publicise their wins, giving a false sense of confidence to their members and unrealistic expectations. I prefer to keep it real and will continue to show my wins, losses, good weeks and bad weeks. There are no guarantees in trading, just probabilities.
Despite the tricky week in Equities, we still hold two profitable scaled long-term positions in the S&P, from 5251 and 5600, as per the daily chart below. Further details can be found in previous newsletters.

The big question is, why were Equities so slippery last week?
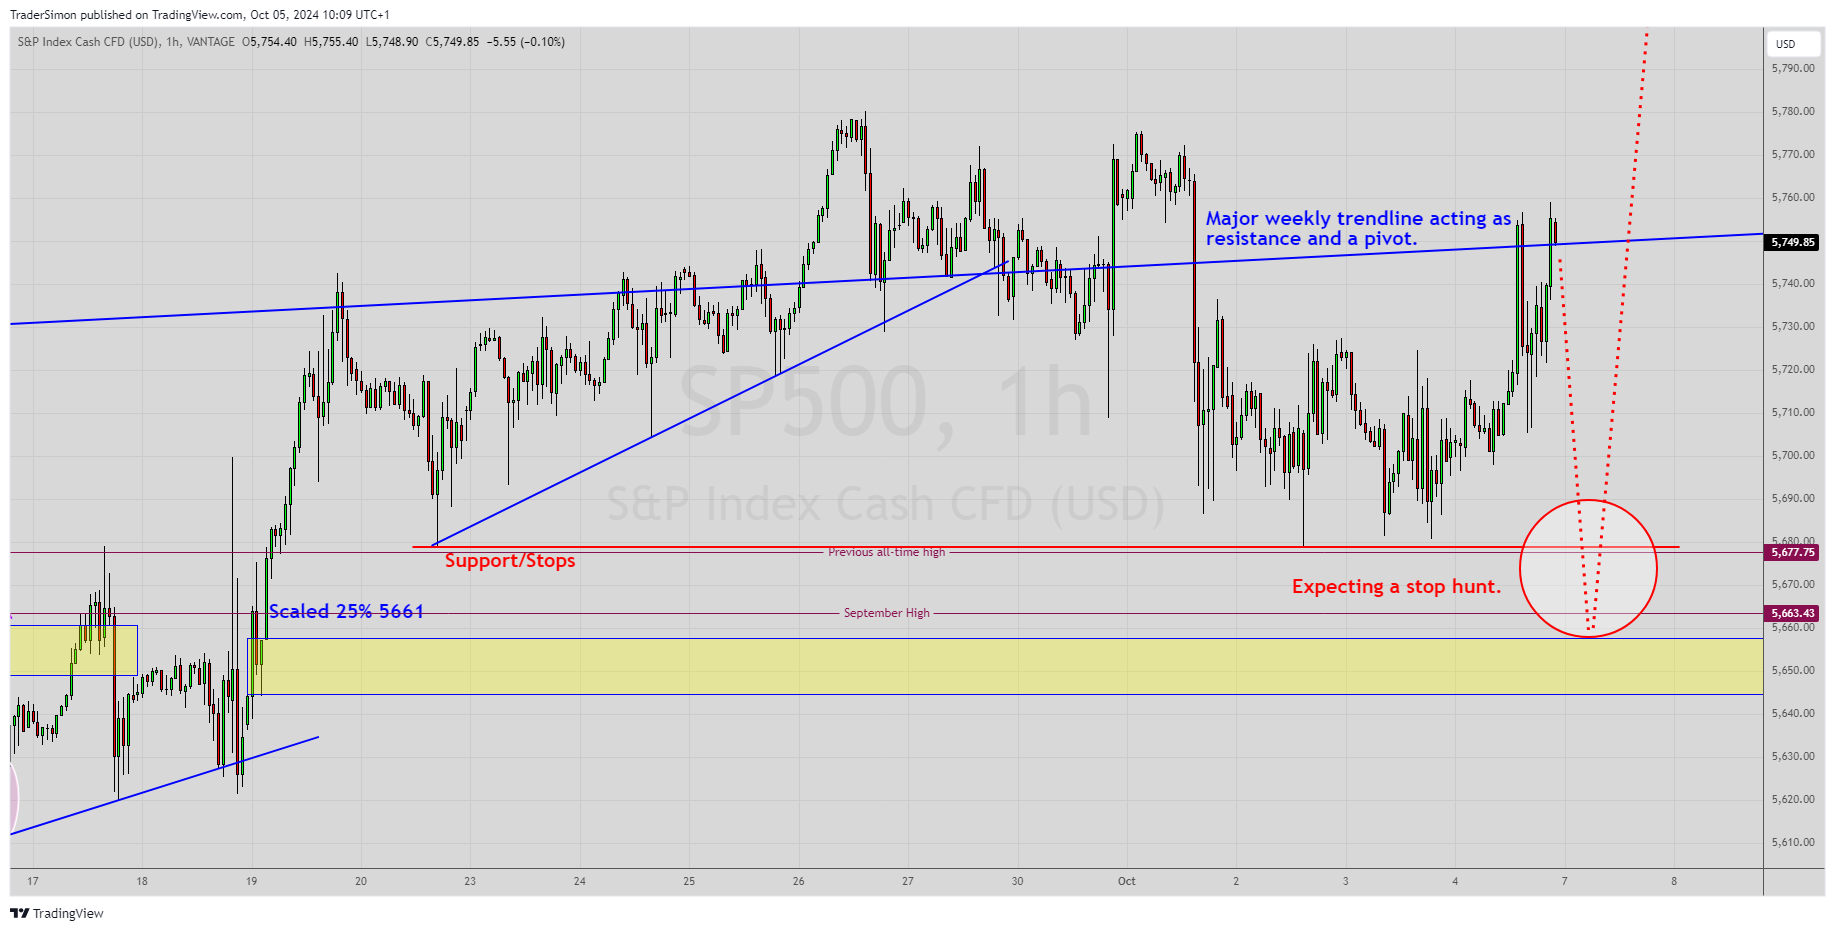
One answer is the S&P has built a support level at 5679 (red line on the chart below). This is only a couple of points above July’s previous all-time high.
As the market continues to range, stops will naturally build below this level, until there is enough liquidity for the market to spike into the stops, which will fuel a move higher.
The other reason is we have a major weekly trendline that is acting as resistance. On the lower timeframes, price has pivoted around this trendline.
Bitcoin:
As mentioned last week, we wanted to see a pullback to our key level at 61K. That has indeed happened and we are now long with a target of 90K. More about Bitcoin later in this newsletter.

Next up for members, we’ll cover the Dollar Index, EUR/USD, Gold, Silver, WTI Oil, S&P 500, Dow Jones, Bitcoin, Dogecoin and Chainlink, including the Dollar Index swing trade that was entered on Friday 👇🏼👇🏼👇🏼