


✍️Weekly Trade Plan & Recap 27th April - 2nd May
The chart patterns that predicted TWO major Bitcoin moves. Plus analysis for the Dollar Index, EUR/USD, Gold, Silver, S&P 500, Nasdaq, WTI Oil and Crypto Alts.


This Substack service has given two great Bitcoin calls recently.
The first was a long in October 2024 at the 61,000 level. Here’s the original chart that was published in the newsletter of 6th-11th October 2024.

That trade was a picture-perfect Bull channel into a major level of confluence, which happened to be Demand, a channel bottom and a Price Pivot Zone.
Although we had to wait patiently for this setup, it didn’t take long for Bitcoin to rocket to our 90k target, which we predicted would happen for the November US elections.
The second target of 102,136 was hit in December, with no pullback.

Our most recent trade was this long entry called on 8th April in the Substack chat at 77,700. Again, it’s a Bull Channel pullback into a major level of support and Fibonacci confluence.
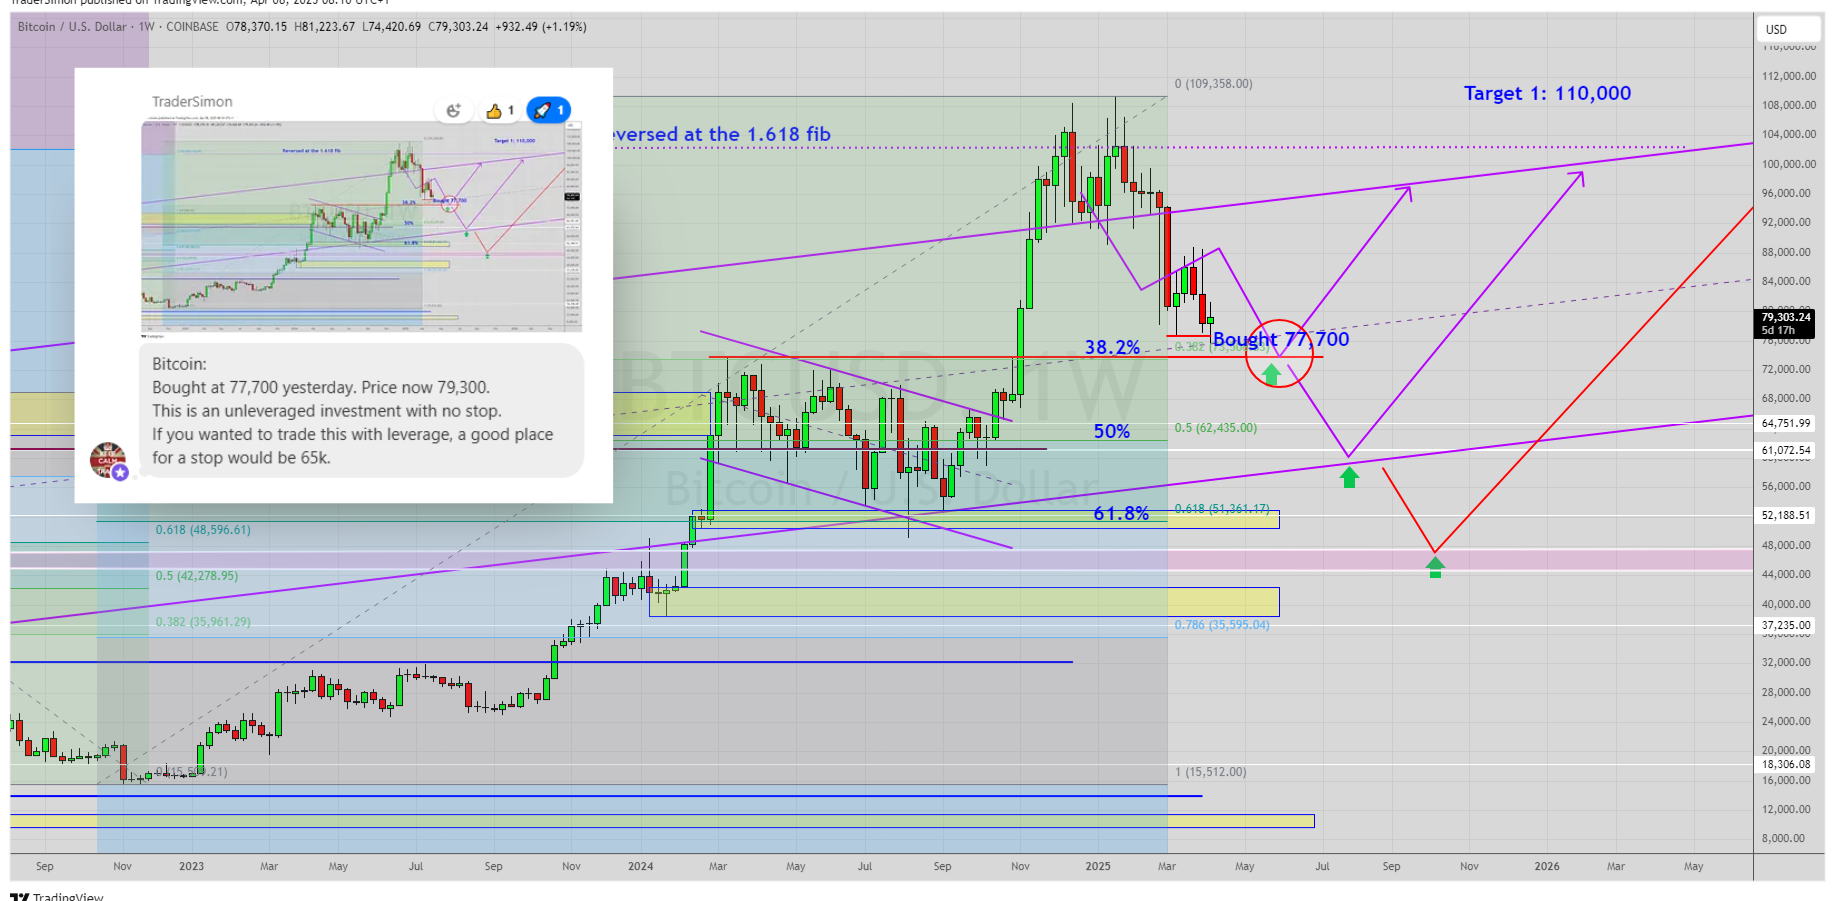
As at the time of writing, Bitcoin has mooned to 94k and we are well on the way to our first target of 110k.
To find out where our 2nd target is, read the remainder of the newsletter!

Up next for members, we’ll look at the Dollar Index, EUR/USD, Gold, Silver, S&P 500, Nasdaq, WTI Oil, Bitcoin, Solana, Ripple and Dogecoin. Full disclosure, we took a couple of losses on Gold last week, but I’ll explain why this is not the end of the Gold bull run and why our very profitable longer-term positions are safe.